This Itechguide teaches you how to make a pie chart in Google Sheets. The guide covers steps to make a pie chart in Google Sheets from a PC, iPhone or Android.
Option 1: Make a Pie Chart from a PC
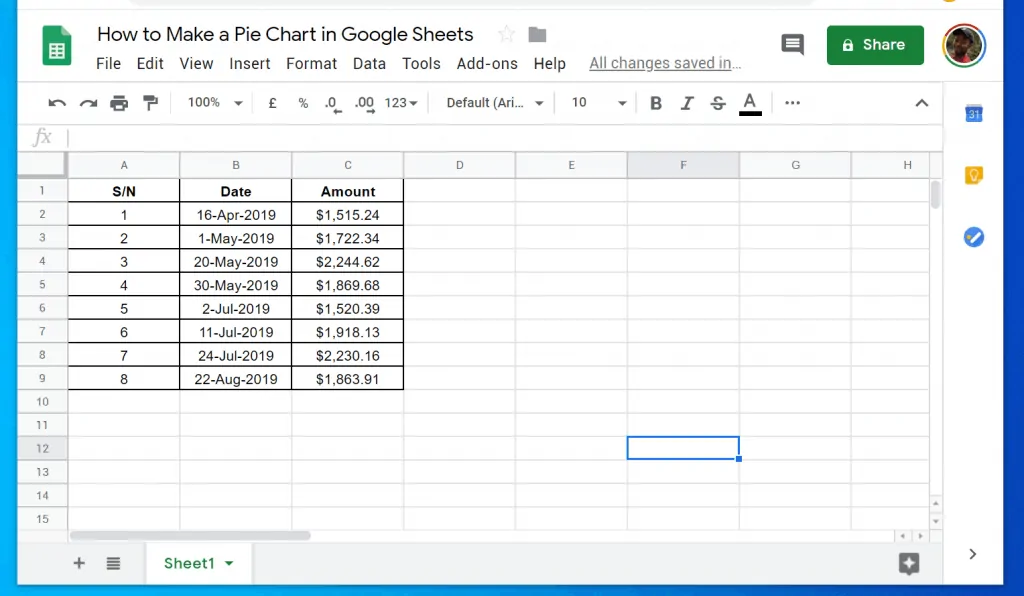
- Open Sheets.Google.com from a browser on your PC. Then, open the Google Spreadsheet with the data you want to use. In this example, I will use the data below.
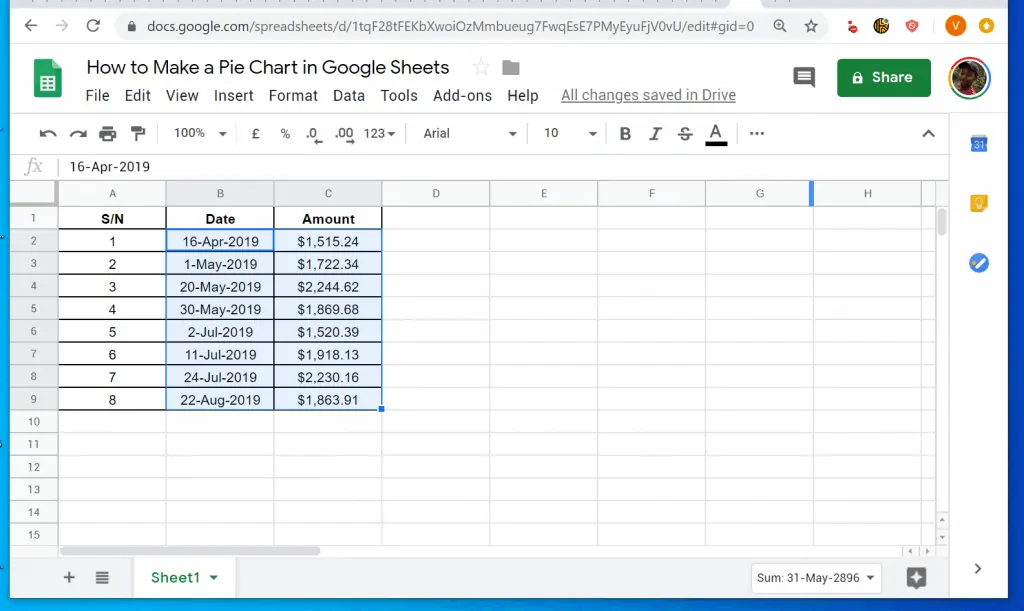
- Highlight the entire data (do not include the headers). In this example, I will highlight from cells B2 to C9 (excludes the data headers).
If you include the data headers, your pie chart may not report the information properly.
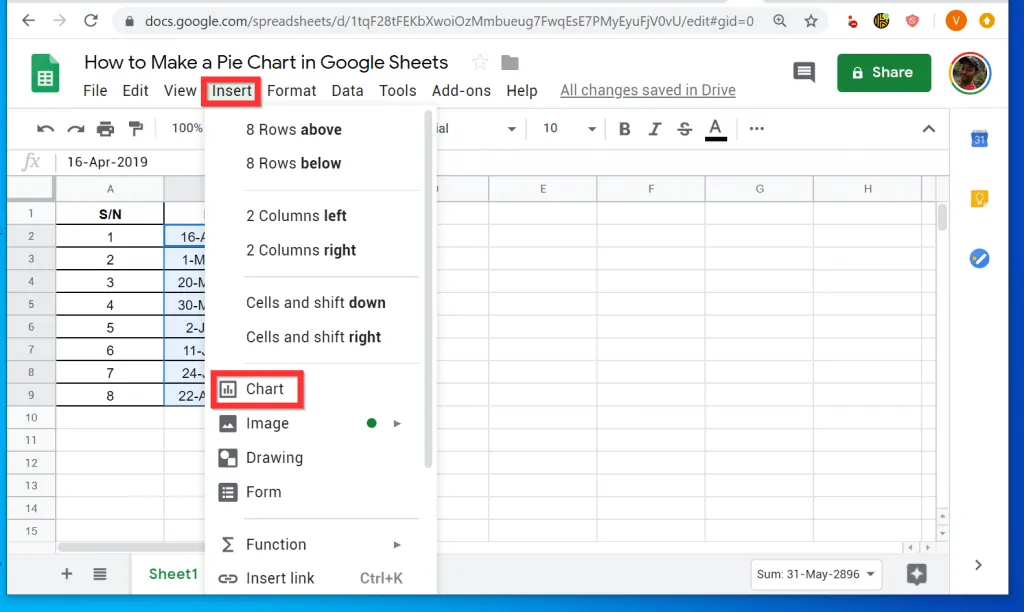
- With your data highlighted, at the menu of the spreadsheet, click Insert. Then from the displayed options, click Chart.
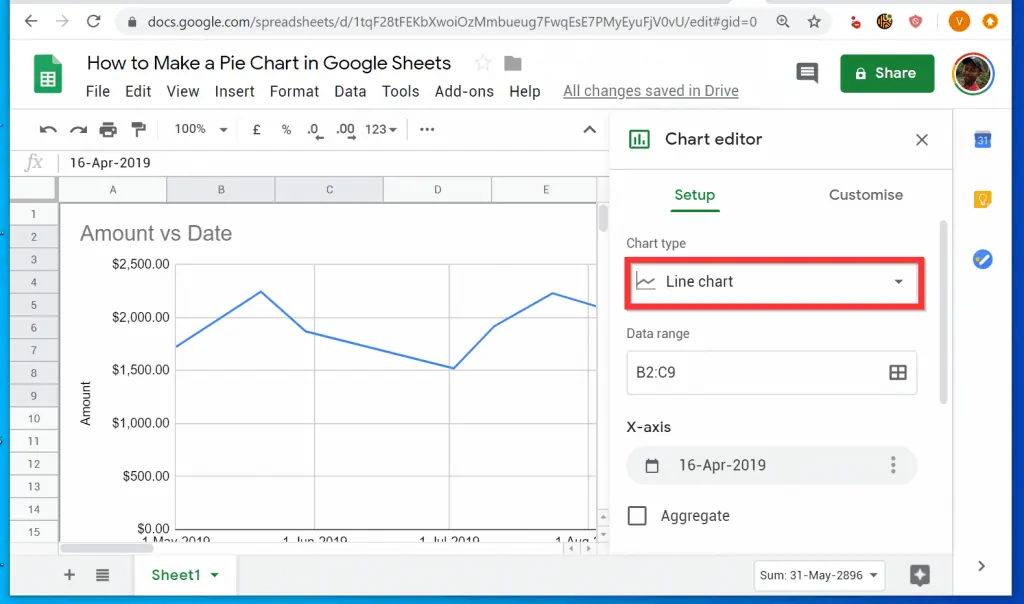
- A line chart will be inserted by default. Chart editor will also be displayed on the right corner of the Spreadsheet.
- Beneath Chart editor, click Chart type drop-down. A list of chart types will be displayed.
- Scroll down the displayed chart types until you get to Pie. Then, select the Pie chart style you want to display.

- The line chart will change to a pie chart! To remove Chart editor from the spreadsheet, click the close button on the top right of Chart editor.
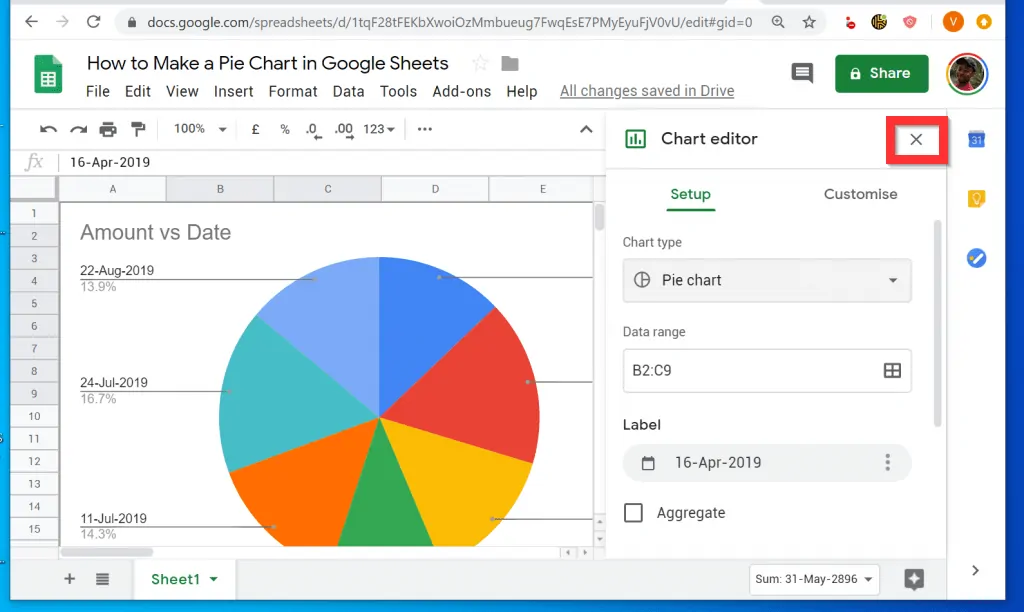
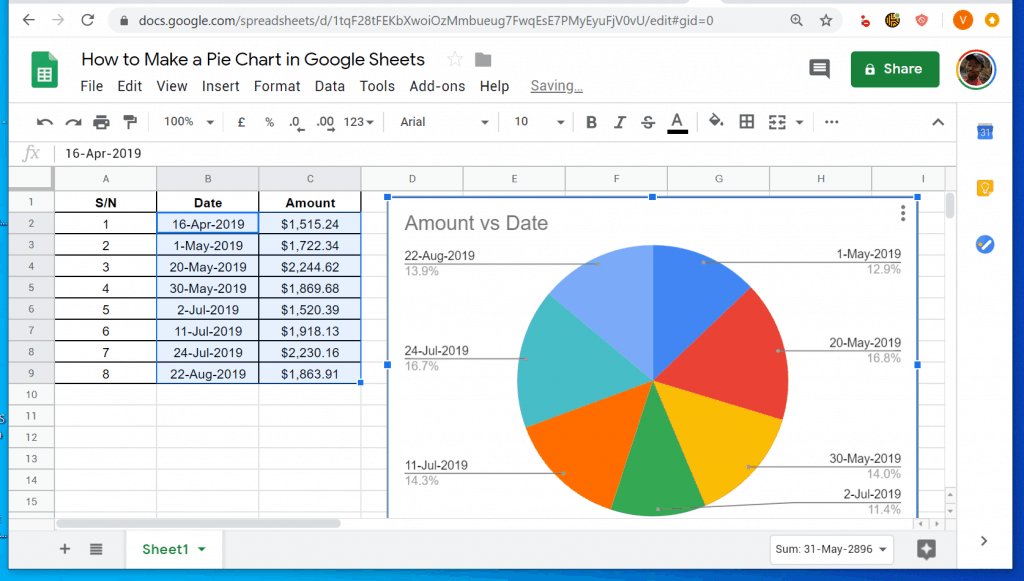
- Finally, drag the pie chart away from your raw data – you may also resize it as you wish.
In the final Pie chart, for each “Pie”, the first header will be displayed on top (in my example, the date). The second header (Amount) is converted to a % and displayed beneath the first header. You can modify the chat using Chart editor. To display Chart editor, double-click the chart.
Option 2: Make a Pie Chart from an iPhone
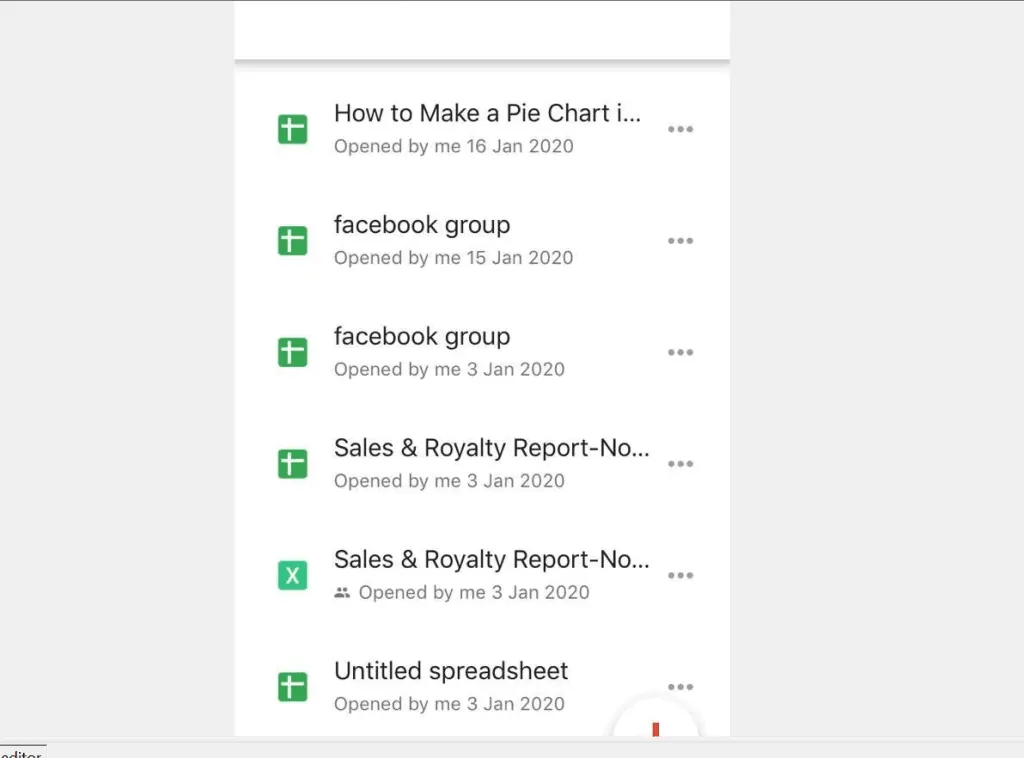
- Open Google Sheets App on your iPhone. Then, open the Spreadsheet with the data you want to use.

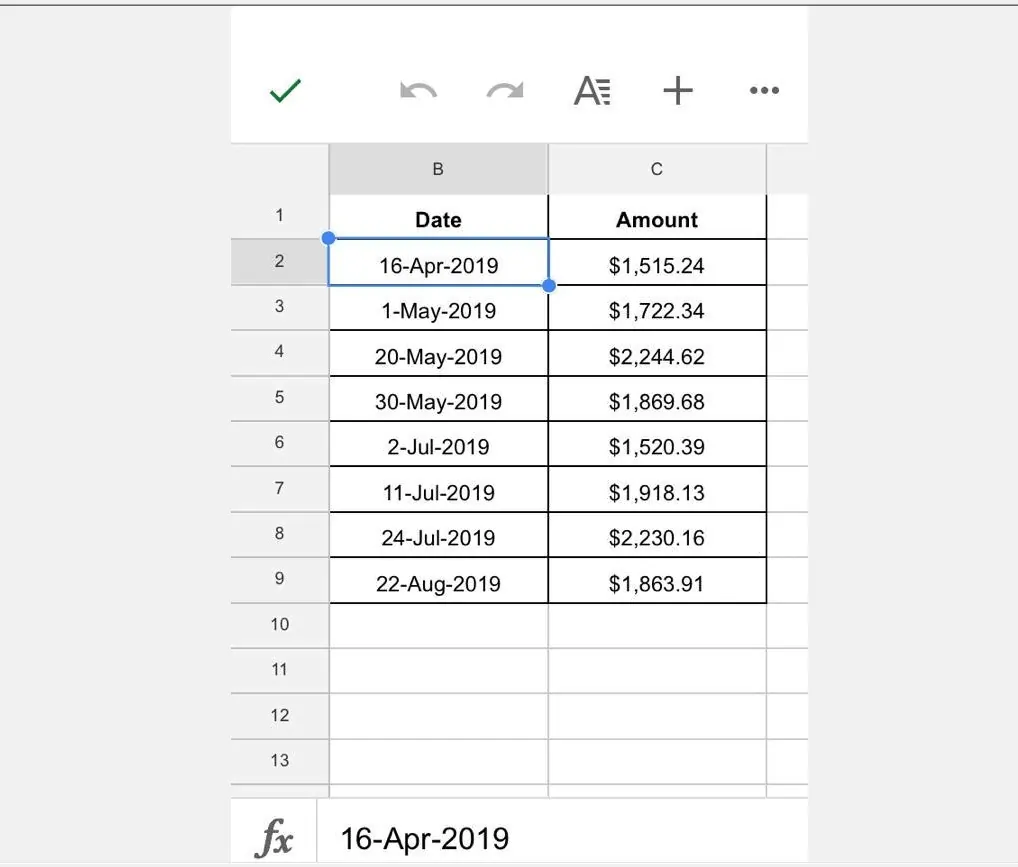
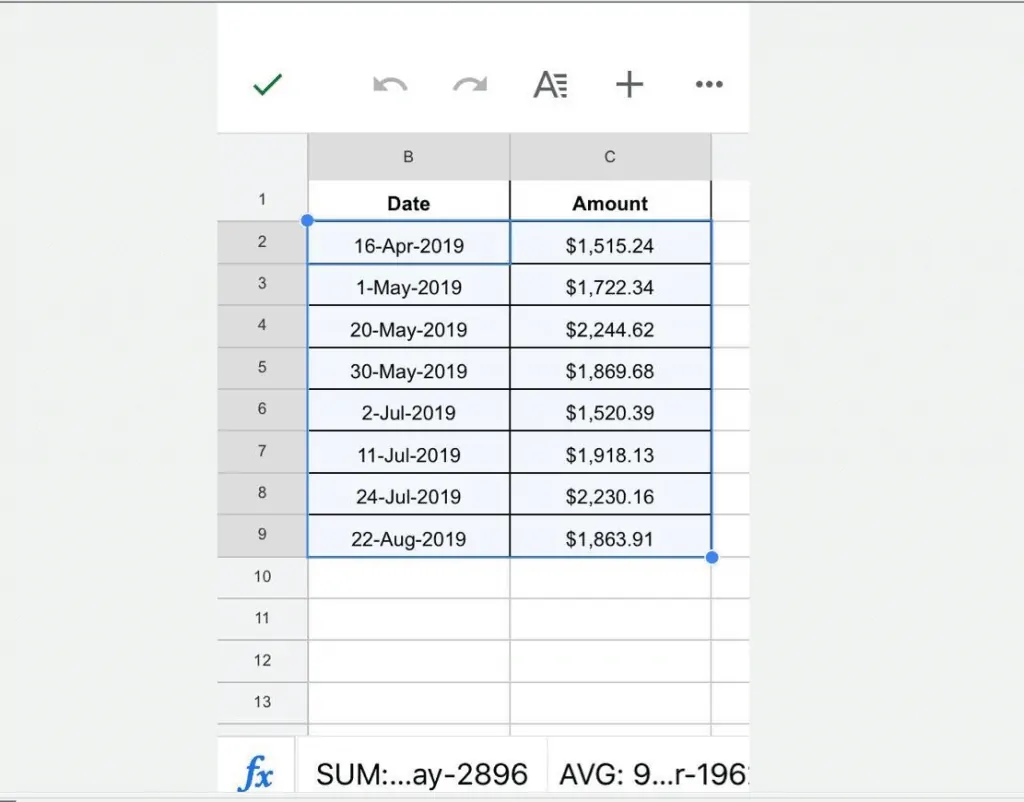
- When the spreadsheet opens, highlight the data (excluding the headers). To highlight the cells with the data, tap on the first cell (in my example, cell B2). Then, drag through the cells to the last cell (cell C9, in my example).
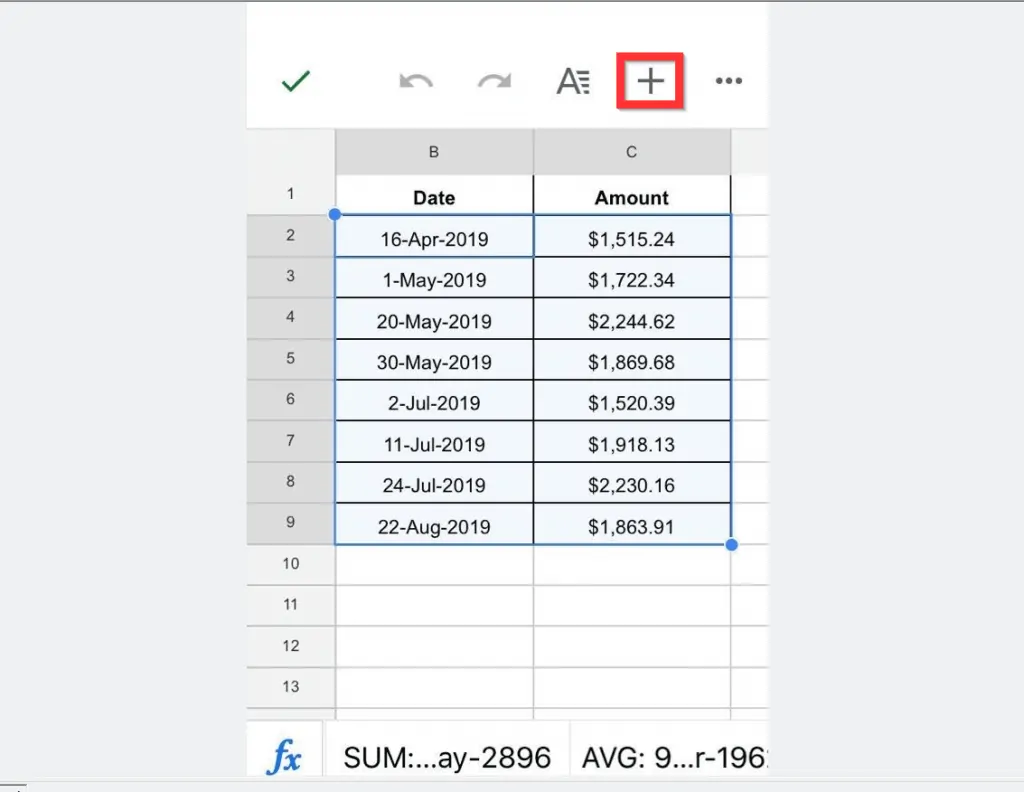
- With the cells highlighted, on the top right of the App, tap the Insert icon (+ sign). A set of Insert options will be displayed.
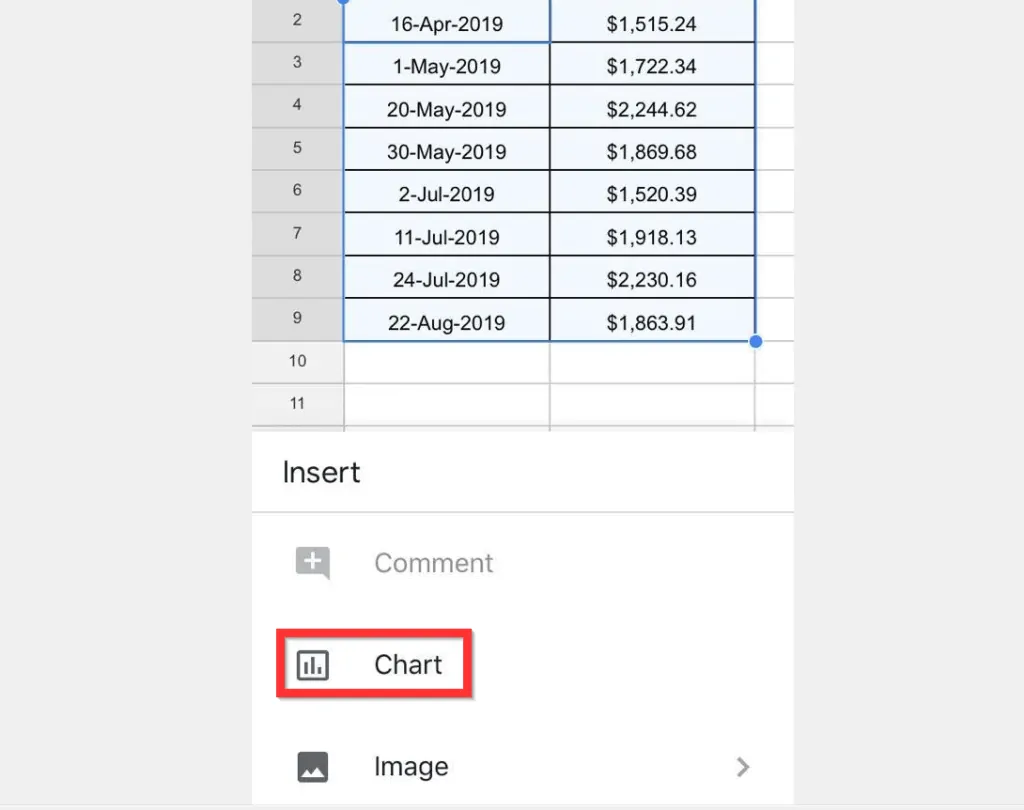
- At the bottom of the screen, on the Insert option, tap Chart. Line chart will be inserted by default.
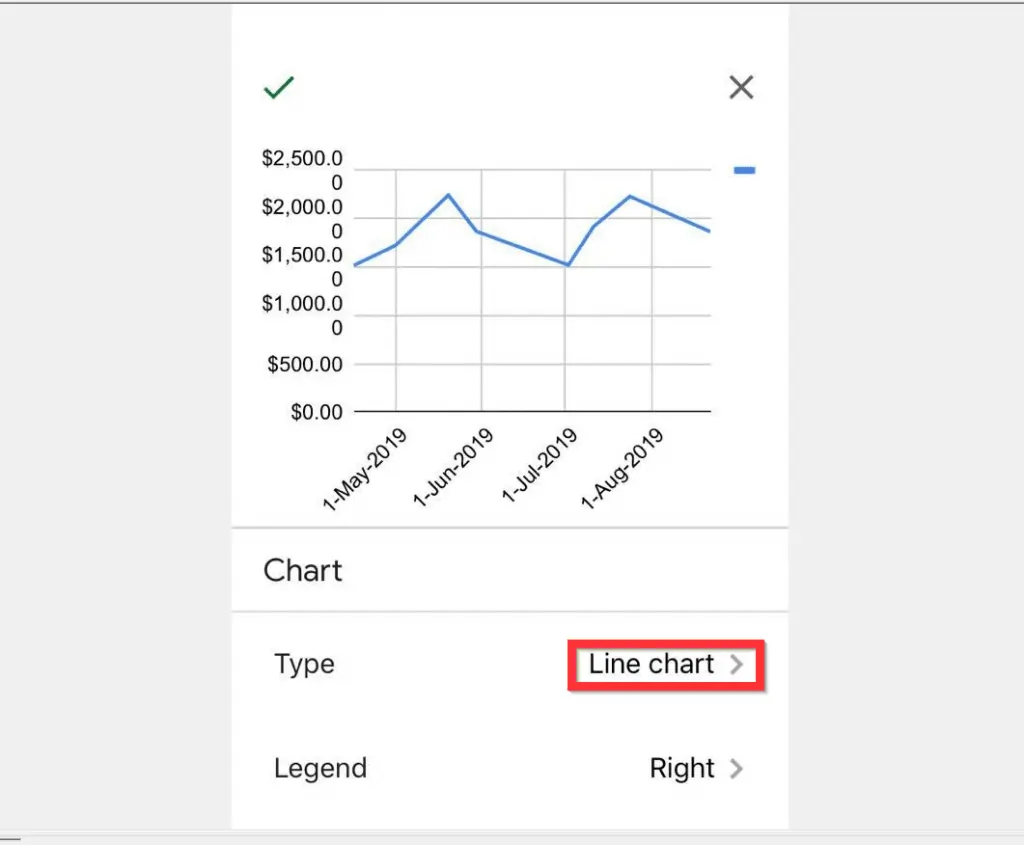
- To change the chart type to Pie chart, beneath the chart, tap Line Chart. A list of chart types will be displayed.
- Scroll down the chart types list to Pie. Then, tap on the Pie chart style you want to display. The chart will change from Line to Pie chart.
- Finally, to save your changes, on the top left of the screen, tap Done.
Option 3: Make a Pie Chart from an Android
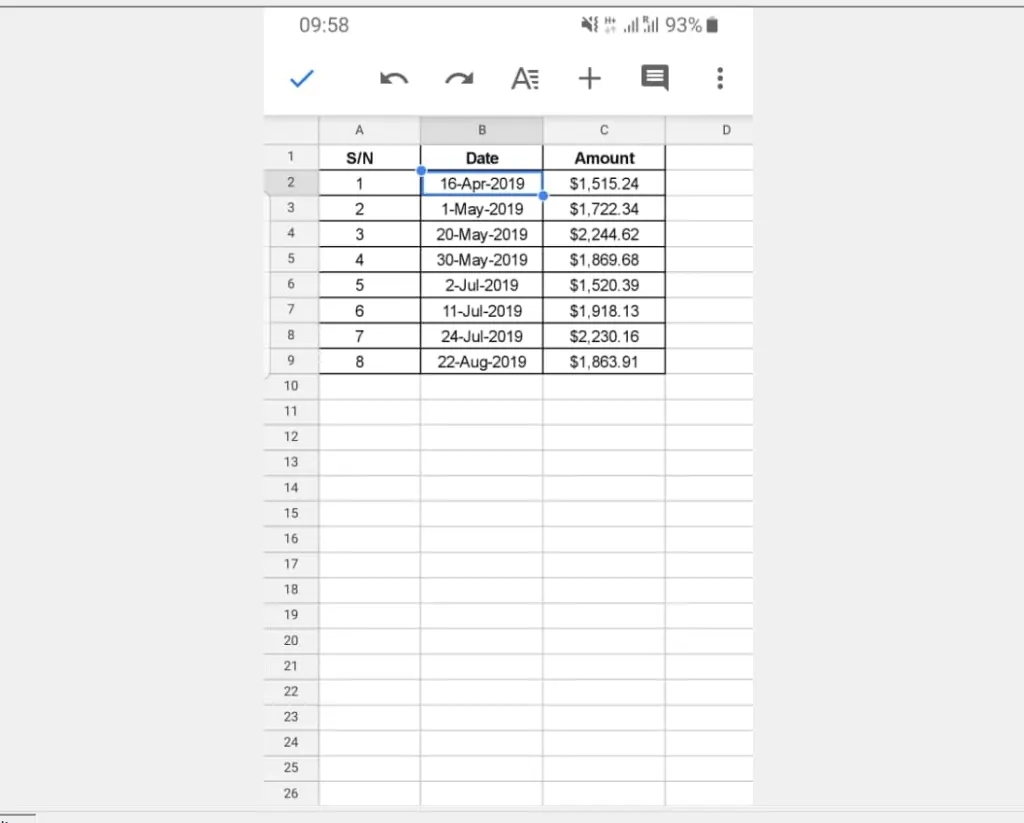
- Open Google Sheets App on your Android phone. Then, open the Google Spreadsheet with the data you want to use to make Pie chart.

- Select the cells containing the data (do not include the headers). To highlight the cells, tap on the first cell. Then, drag through the cells to the last cell containing data.
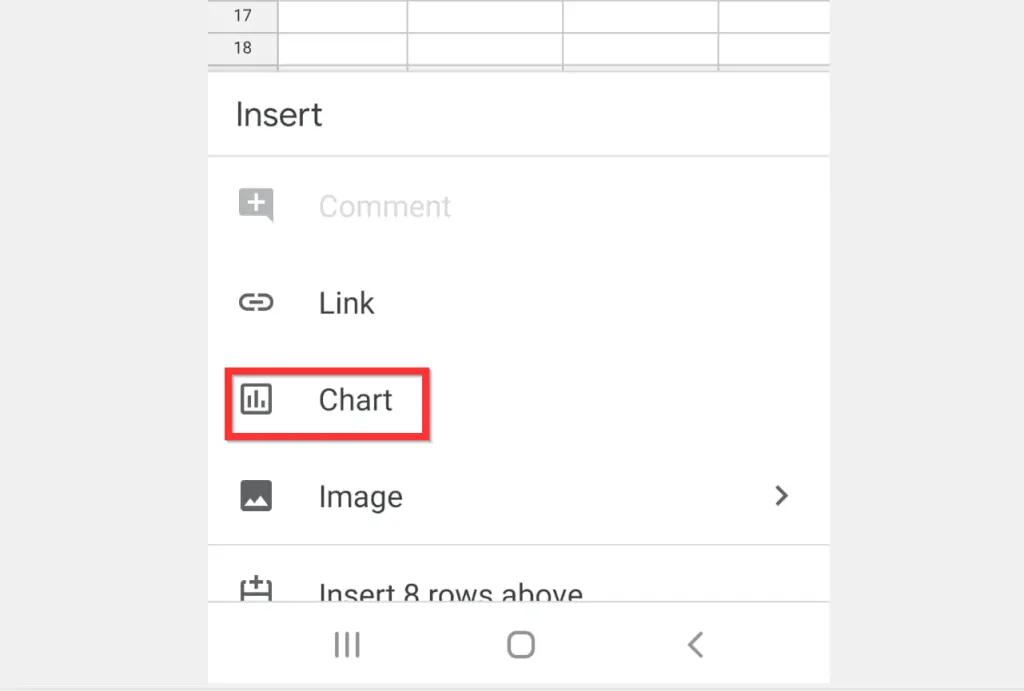
- With the cells highlighted, on the top right of the menu, tap Insert (+ sign). At the bottom of the screen, a list of Insert options will be displayed.
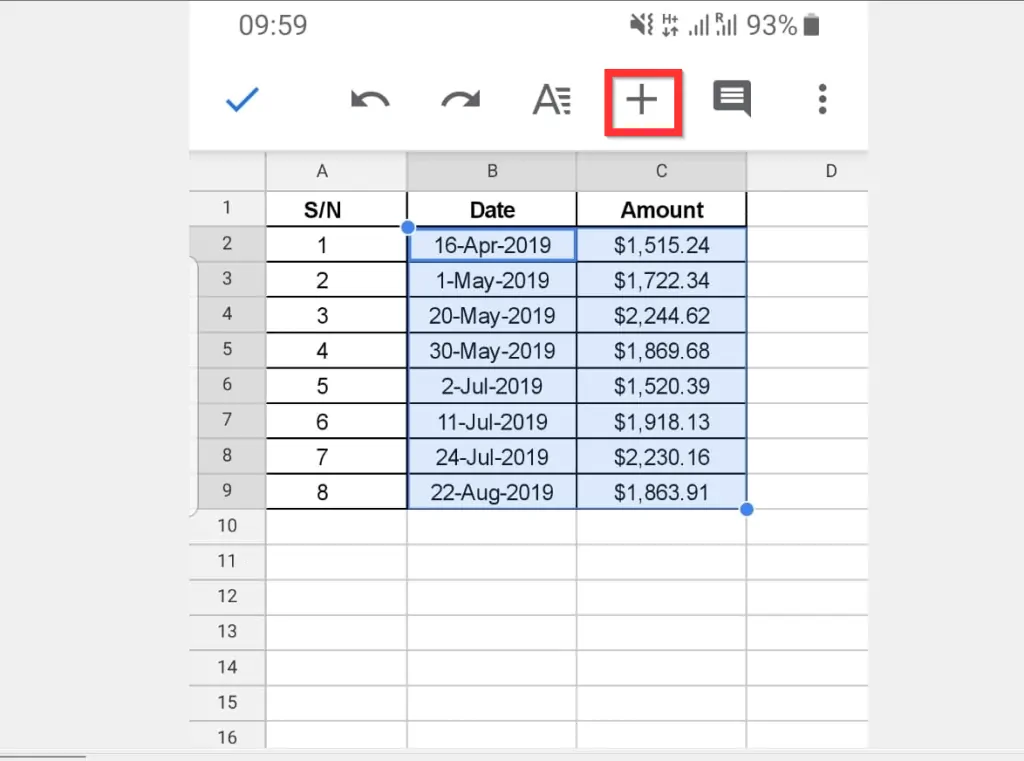
- From the Insert options, tap Chart. Line Chart will be inserted.
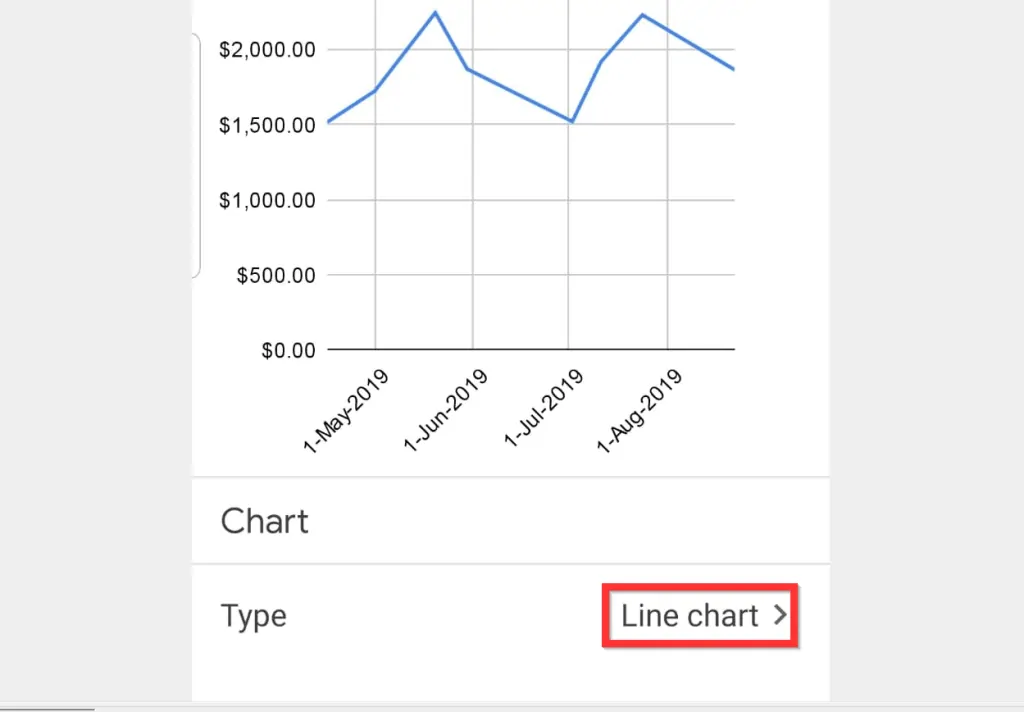
- To change the chart type from Line chart to Pie chart, beneath Chart (bottom of your screen), beside Type, tap Line chart. A set of chart types will be displayed.
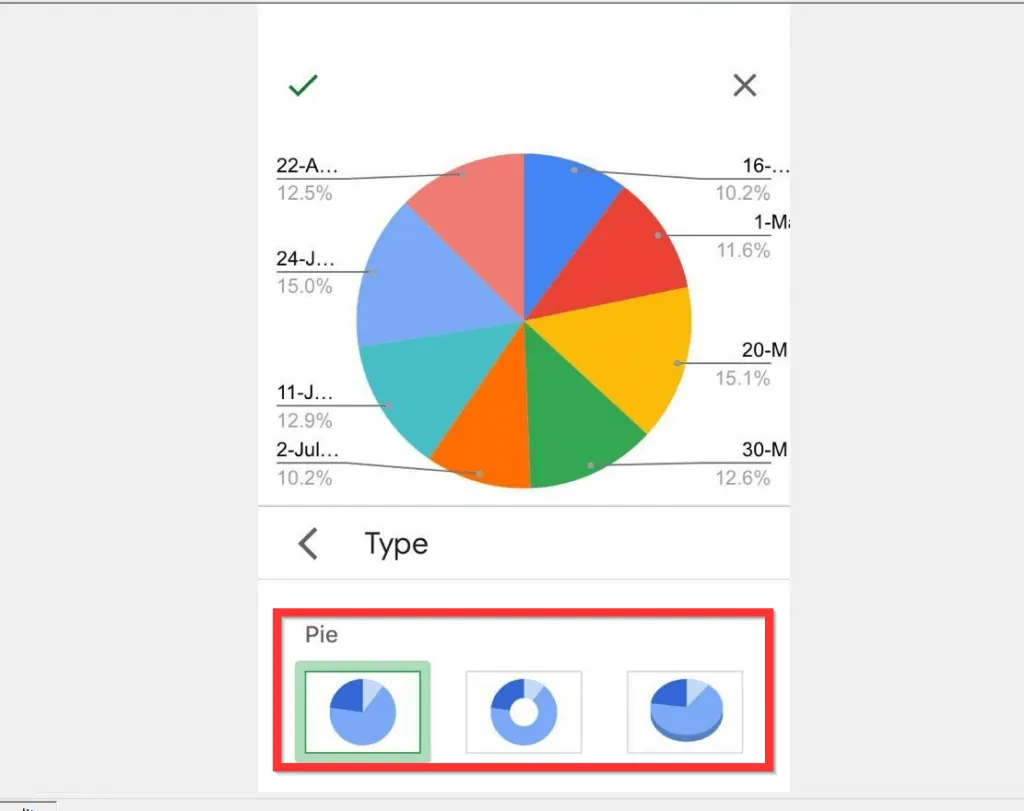
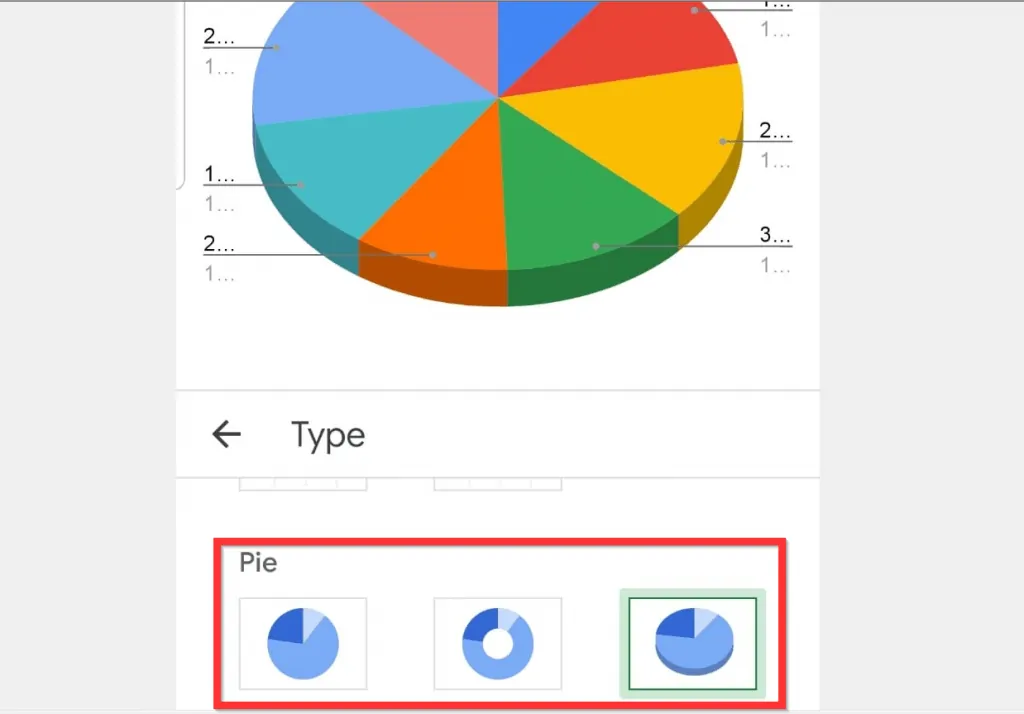
- Scroll down the displayed chart types until you locate Pie. Tap the Pie chart style you want to use. The chart will change from Line to Pie chart.
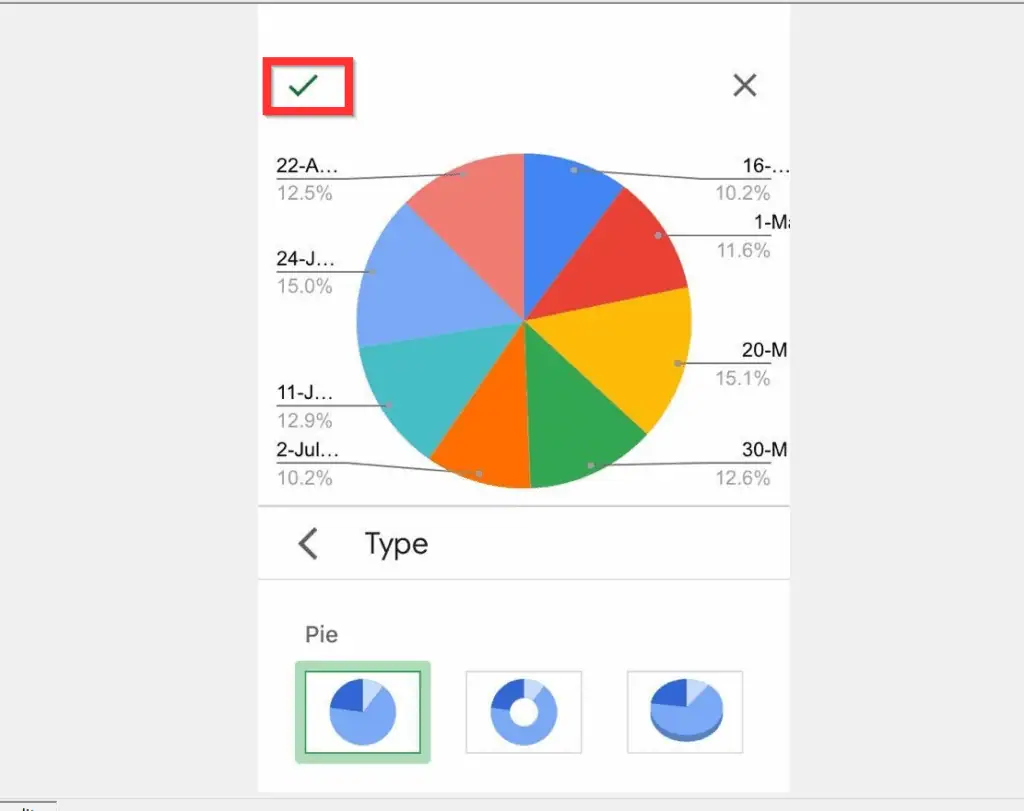
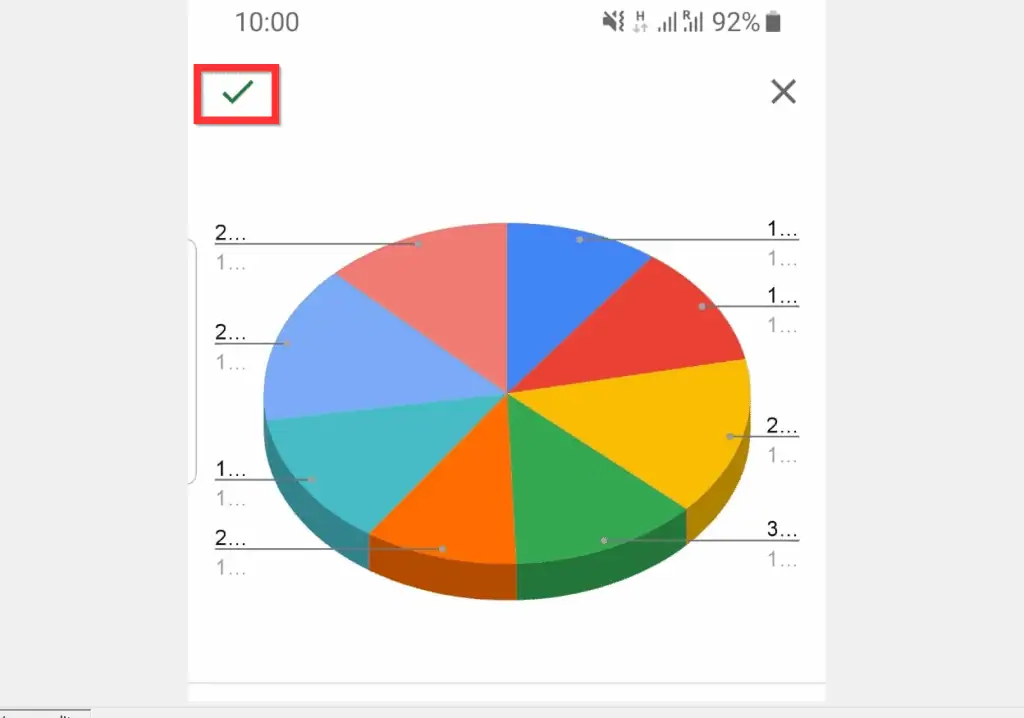
- Finally, at the top left of the screen, tap the highlighted icon.
It is this easy to make a pie chart in Google Sheets! I hope you found this Itechguide helpful.If you found it helpful, click on “Yes” beside the “Was this page helpful” question below.
You may also express your thoughts and opinions by using the “Leave a Comment” form at the bottom of this page.
Finally, for more Google Itechguides, visit our Google How To page.