
CUDA-GDB
CUDA-GDB: A capable open-source debugger for inspecting CUDA CPU and GPU execution together. Ranked #8 of 27 in Debuggers by our editors (8.3/10); pricing: Open source; best for CUDA CPU/GPU debugging.
At a glance
- Editor score8.3 / 10
- PricingOpen source
- Best forCUDA CPU/GPU debugging
- Paid fromFree
- Supported languagesC/C++, Fortran
- Founded1993 · Santa Clara, California, United States
- Facts checked20 Sep 2026
Where it wins
- Debugs CPU and GPU code simultaneously
- Supports CUDA C/C++, Fortran, remote sessions, and core dumps
- Inspects GPU state across multi-GPU debugging sessions
Where it doesn't
- Focused on NVIDIA GPU development
- Listed platform coverage centers on Linux
- Command-line workflow may not suit every development team
Our verdict on CUDA-GDB
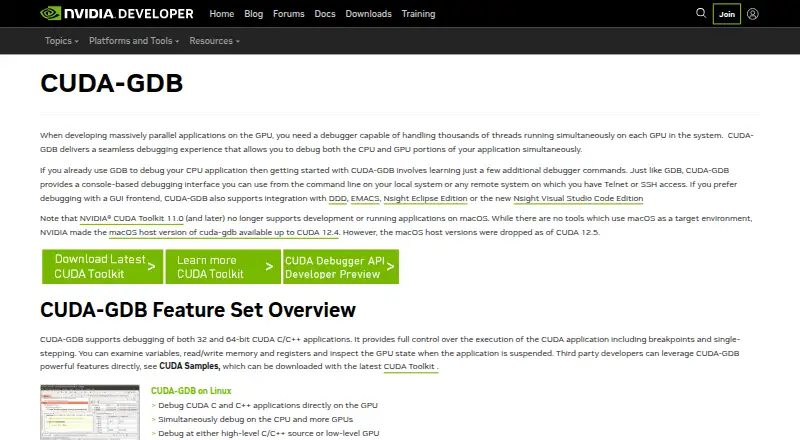
CUDA-GDB is NVIDIA's open-source extension to the GNU Project Debugger for debugging CUDA applications on actual NVIDIA hardware. It is aimed at developers working with CUDA C/C++, CUDA Fortran, and mixed CPU/GPU programs who need one debugger for host and device execution. Its core workflow includes source-level debugging, GPU assembly inspection, single-stepping, kernel-entry breakpoints, and conditional breakpoints based on CUDA thread and block variables. Variable, memory, register, and GPU-state inspection add visibility into device behavior that is difficult to diagnose from CPU-side debugging alone.
The published distribution model is straightforward: CUDA-GDB is included with NVIDIA's CUDA Toolkit and is described as open source, rather than presented as a standalone commercial product. Its feature set also covers multi-GPU and multiple-session debugging, remote debugging through cuda-gdbserver, and inspection of GPU and GPU-plus-CPU core dumps. The documentation describes Linux and QNX targets, while the listed platform coverage is Linux. CUDA-GDB also integrates with DDD, Emacs, Nsight Eclipse Edition, and Nsight Visual Studio Code Edition, giving teams several ways to connect the debugger to an existing development workflow.
CUDA-GDB is a strong fit when diagnosing kernels, GPU memory, thread behavior, registers, or mixed host-device execution is central to the work. Its narrow focus is also its main boundary: this is a CUDA debugger for NVIDIA hardware, not a general-purpose debugger for varied accelerator ecosystems. The command-line foundation may appeal to developers who want direct control and scriptable debugging, while teams seeking a broader visual debugging environment may prefer a tool aligned more closely with their existing IDE. Choose CUDA-GDB for detailed CUDA execution analysis, remote debugging, and dump inspection; consider an alternative when wider platform coverage matters more than CUDA-specific depth.
Your product? Our editors can test CUDA-GDB in depth and publish a review, labelled as paid · from $149/mo →
CUDA-GDB pricing
CUDA-GDB fact sheet
| Free plan | Not verified |
|---|---|
| Paid from | Free |
| Supported languages | C/C++, Fortran |
| Target platforms | Linux, QNX |
| Remote debugging | Yes |
| Conditional breakpoints | Yes |
| Exception breakpoints | Not verified |
| Time-travel debugging | Not verified |
| Core dump debugging | Yes |
| Deployment | Desktop |
| Platforms | Linux |
| Support | Email, Community, Docs |
| Built for | Solo, Small business, Mid-market, Enterprise (editorial estimate) |
| Integrations | 4 integrations: DDD, Emacs, Nsight Eclipse Edition, Nsight Visual Studio Code Edition |
| Pricing | Open source |
| Website | developer.nvidia.com |
| Facts checked | 20 Sep 2026 |
CUDA-GDB integrations
CUDA-GDB lists 4 integrations on its own site.
- DDD
- Emacs
- Nsight Eclipse Edition
- Nsight Visual Studio Code Edition
Alternatives to CUDA-GDB
- GDBA free, open-source debugger with unusually broad language, target, and remote-debugging coverage.9.4
- LLDBA capable, free debugger for C/C++ and Apple-platform development.9.2
- WinDbgA free, deeply capable debugger for Windows applications, drivers, and crash analysis.9.0


See all CUDA-GDB alternatives →
CUDA-GDB vs the competition
- CUDA-GDB vs GDB
- CUDA-GDB vs LLDB
- CUDA-GDB vs WinDbg
- CUDA-GDB vs Delve
- CUDA-GDB vs Xdebug
- CUDA-GDB vs IDA Pro


Compare CUDA-GDB with any tool side by side →
Used CUDA-GDB? Be the first to review it
The editor score above is our own research. What this page doesn't have yet is a reader's view — what you used CUDA-GDB for, what worked and what didn't. No stars are seeded and no review is paid for; an editor reads every one before it appears.
Write a reviewTwo minutes · verified accounts only · read by an editor before it appears
Featured on iTechGuides

CUDA-GDB is listed in our Debuggers directory. Add the badge to your site — it links back to this page.
<a href="https://www.itechguides.com/products/cuda-gdb/"><img src="https://www.itechguides.com/best/badge/cuda-gdb.svg" alt="Featured on iTechGuides" width="230" height="46"></a>
Reviewed by iTechGuides Editors · Editorial team · Updated Oct 2026
Advertiser disclosure: iTechGuides is reader-supported. Vendors can pay for top positions in our rankings and for a place on other products' pages, and we may earn a commission when you click some links. Bought places stand at the number bought; this page and our disclosure say so. Paying vendors may get a fuller, more detailed review from our editors, and that review can change their score. How we rank.
Last updated · How we research and update