
GDB
GDB: A free, open-source debugger with unusually broad language, target, and remote-debugging coverage. Ranked #1 of 27 in Debuggers by our editors (9.4/10); pricing: Free plan; best for broad native and systems debugging.
At a glance
- Editor score9.4 / 10
- PricingFree plan
- Best forBroad native and systems debugging
- Free planYes
- Paid fromFree
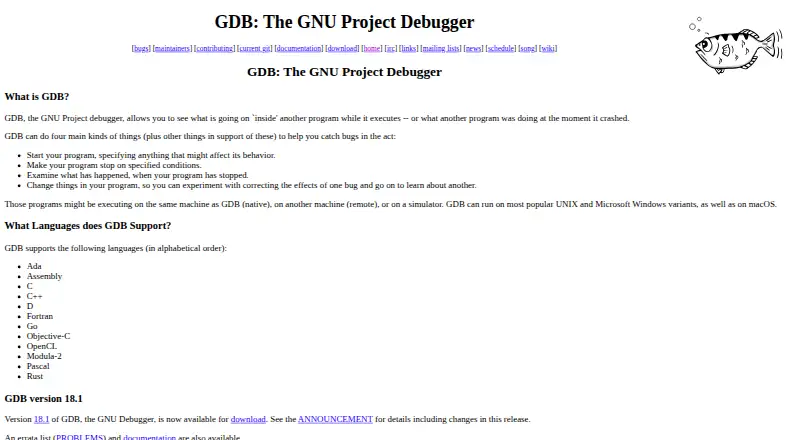
- Supported languagesAda, Assembly, C, C++, D, Fortran, Go, Objective-C, OpenCL, Modula-2, Pascal, Rust
- Facts checked20 Sep 2026
Where it wins
- Supports Ada, C, C++, Go, Rust, Fortran, Pascal, and assembly
- Includes remote debugging, core dumps, and simulator targets
- Offers reverse execution, replay, and program-state modification
Where it doesn't
- No AI-assisted debugging features
- Remote debugging uses serial, socket, TCP, or UDP connections
- Its language coverage centers on native and systems-oriented development
Our verdict on GDB
GDB is a free, open-source source-level debugger for examining programs while they run or after they crash. It is aimed at developers working across native applications, systems software, embedded or remote targets, and simulator environments. GDB runs on UNIX, Microsoft Windows, and macOS, and supports native, remote, and simulator targets. Its language coverage includes Ada, Assembly, C, C++, D, Fortran, Go, Objective-C, OpenCL, Modula-2, Pascal, and Rust.
The feature depth is strongest around execution control and program-state inspection. Developers can set conditional breakpoints, watchpoints, and catchpoints, including C++ and Ada exception catchpoints. GDB can inspect and generate core dumps, modify program state during a debugging session, and record execution for replay and reverse execution. These capabilities make it suitable when diagnosing difficult runtime behavior, investigating crashes after the fact, or tracing problems that are hard to reproduce with ordinary forward execution.
Its ecosystem fit is broad rather than tied to one editor, language, or target. Remote debugging works over serial connections, sockets, TCP, and UDP, while support for multiple programming languages and major desktop operating systems gives it a wide range of possible environments. The trade-off is focus: GDB provides debugging depth rather than AI-assisted guidance. Choose it for broad native, systems, remote, and post-crash debugging at no software cost. An alternative may suit teams specifically seeking AI features or a narrower workflow built around a single language or development environment.
Your product? Our editors can test GDB in depth and publish a review, labelled as paid · from $149/mo →
GDB pricing
GDB fact sheet
| Free plan | Yes |
|---|---|
| Paid from | Free |
| Supported languages | Ada, Assembly, C, C++, D, Fortran, Go, Objective-C, OpenCL, Modula-2, Pascal, Rust |
| Target platforms | UNIX, Microsoft Windows, macOS; native, remote, and simulator targets |
| Remote debugging | Yes |
| Conditional breakpoints | Yes |
| Exception breakpoints | Yes |
| Time-travel debugging | Yes |
| Core dump debugging | Yes |
| Deployment | Desktop |
| Platforms | Windows, macOS, Linux |
| Support | Community, Docs |
| Built for | Solo, Small business, Mid-market, Enterprise (editorial estimate) |
| Pricing | Free plan |
| Website | sourceware.org |
| Facts checked | 20 Sep 2026 |
Alternatives to GDB
- LLDBA capable, free debugger for C/C++ and Apple-platform development.9.2
- WinDbgA free, deeply capable debugger for Windows applications, drivers, and crash analysis.9.0
- DelveA deep, free Go debugger for developers who need process and runtime control.8.8

GDB vs the competition


Compare GDB with any tool side by side →
Also Ranked In
GDB is ranked in 2 of our directories.
Used GDB? Be the first to review it
The editor score above is our own research. What this page doesn't have yet is a reader's view — what you used GDB for, what worked and what didn't. No stars are seeded and no review is paid for; an editor reads every one before it appears.
Write a reviewTwo minutes · verified accounts only · read by an editor before it appears
Featured on iTechGuides

GDB is listed in our Debuggers directory. Add the badge to your site — it links back to this page.
<a href="https://www.itechguides.com/products/gdb/"><img src="https://www.itechguides.com/best/badge/gdb.svg" alt="Featured on iTechGuides" width="230" height="46"></a>
Reviewed by iTechGuides Editors · Editorial team · Updated Oct 2026
Advertiser disclosure: iTechGuides is reader-supported. Vendors can pay for top positions in our rankings and for a place on other products' pages, and we may earn a commission when you click some links. Bought places stand at the number bought; this page and our disclosure say so. Paying vendors may get a fuller, more detailed review from our editors, and that review can change their score. How we rank.
Last updated · How we research and update