
Recommended Free Tools
iTechGuides is reader-supported. When you buy through links on our site, we may earn an affiliate commission. As an Amazon Associate I earn from qualifying purchases. Learn more
There is no single best free and open-source way to monitor your home network: Uptime Kuma checks availability, SmokePing tracks latency, LibreNMS monitors SNMP devices, and ntopng analyzes traffic. Most homes need one or two complementary tools, plus a continuously running host and router or switch hardware that exposes useful telemetry.
“Monitor my home network” can mean several different things. You might want to know whether the internet is down, which device is consuming bandwidth, whether Wi-Fi is introducing packet loss, whether a NAS is healthy, or whether an unexpected device is making unusual DNS requests.
The ten approaches below are therefore ranked by use case rather than treated as interchangeable products. Some are complete monitoring platforms; others are protocols, router features, dashboards, or focused diagnostic tools.
Free tools Windows power users keep installed
One-click scans. No signup required.
Key takeaways
- Uptime Kuma is the simplest starting point for checking hosts, ports, websites, DNS services, and self-hosted applications.
- SmokePing is better than a basic ping monitor for finding long-term latency, jitter, and packet-loss patterns across several network points.
- LibreNMS, Zabbix, and Prometheus can monitor routers, switches, servers, and NAS devices, but they require telemetry such as SNMP, agents, or exporters.
- ntopng can identify traffic patterns and top talkers only when it receives traffic through a mirror port, TAP, flow export, or a gateway it can observe.
- Pi-hole and AdGuard Home show DNS requests, not a complete record of internet activity or transferred bandwidth.
- A self-hosted monitor cannot reliably prove that your entire home is reachable from the public internet; an external probe is a useful companion for that question.
What does “monitor my home network” actually mean?
Home-network monitoring is a layered problem involving availability, device health, traffic, latency, DNS, and sometimes security detection. The correct tool depends on which measurement you need.
Popular on Amazon

- GIGABIT ETHERNET PORTS: Features 5 x 1.0Gbps Ethernet ports for high-speed connectivity. Auto-negotiating ports detect the optimal speed for connected devices and work with existing Cat5e or Cat6 Ethernet cables.
- PLUG-AND-PLAY UNMANAGED NETWORK SWITCH: Simple plug-and-play setup with no software to install or configuration required.
- FLEXIBLE MOUNTING OPTIONS: Compact metal design supports desktop or wall-mount placement for versatile installation.
- SILENT & ENERGY-EFFICIENT OPERATION: Fanless design ensures silent performance, while IEEE 802.3az Energy Efficient Ethernet reduces power consumption without compromising high-speed network performance.
- REGIONAL COMPATIBILITY: Made for use in U.S. & CA only
| Goal | Useful measurements | Best-fit options |
|---|---|---|
| Detect outages | Ping, TCP, HTTP, HTTPS, and DNS checks | Uptime Kuma, SmokePing, Prometheus Blackbox Exporter |
| Find bandwidth hogs | Per-device traffic, flows, protocols, and top talkers | ntopng, router accounting, NetFlow, IPFIX, or sFlow |
| Monitor router and switch health | Interface status, bytes, errors, discards, CPU, memory, temperature, and uptime | SNMP with LibreNMS, Zabbix, or Grafana |
| Track latency | Round-trip time, packet loss, and variation over time | SmokePing, Blackbox Exporter, or LibreNMS |
| Monitor servers and NAS devices | CPU, RAM, disks, processes, services, and network interfaces | Netdata, Zabbix, Prometheus exporters |
| Track DNS activity | Client queries, requested domains, and blocked requests | Pi-hole or AdGuard Home |
| Detect suspicious traffic | IDS signatures, protocol behavior, and flow metadata | Suricata, Zeek, or Wazuh as a separate security layer |
| Receive alerts | Email, webhooks, Matrix, Telegram, Discord, or push notifications | The notification integrations supported by each platform |
Availability monitoring answers “does this endpoint respond?” SNMP monitoring answers “how is this network device behaving?” Traffic analysis answers “who is using the connection?” Latency monitoring answers “where is delay or packet loss occurring?” DNS monitoring answers “which names are clients requesting?” Ordinary uptime monitoring does not provide full security monitoring.
What do you need before installing a monitor?
Every self-hosted monitoring system needs a device that stays powered on. Suitable choices include a Raspberry Pi, mini PC, NAS, virtual machine, Docker host, or spare server. The monitoring host should have a stable management IP address or DNS name and enough storage for the retention period you actually need.
You also need administrative access to the router, switches, access points, servers, and NAS devices you want to monitor. A monitoring application cannot recover data that the network equipment does not expose.
Check what your router and switch support
Useful capabilities include SNMPv3, SNMPv2c, NetFlow, IPFIX, sFlow, port mirroring or SPAN, syslog, vendor APIs, and Prometheus-compatible metrics. Many consumer routers expose only a client list and basic bandwidth graphs. Such a router may allow gateway and internet checks but may not support detailed per-device monitoring.
SNMP usually provides aggregate interface counters rather than application-level traffic for each client. Detailed traffic visibility may require router-native accounting, flow export, packet capture, or a mirrored switch port.
Where should the monitoring host be located?
Place the monitoring host inside the LAN when you need to check local devices. For important services, use a second vantage point outside the monitored network when possible. A monitor connected to the same switch, power circuit, router, or host as the service can fail at the same time and hide the outage.
Keep alert delivery independent of the failure being measured. If your internet connection is down, an alert that depends exclusively on that same connection may be delayed until service returns.
What’s actually slowing this PC down?
Pick the symptom - the matching free tool is one click away.
1. How can router and switch telemetry monitor a home network?
Router and switch telemetry is the foundational approach: enable SNMP, syslog, and interface counters on the equipment, then send that data to a collector such as LibreNMS, Zabbix, Cacti, or a Prometheus SNMP Exporter.
Telemetry can expose interface up/down status, transmitted and received bytes, packet counts, errors, discards, uptime, and—when supported—CPU, memory, temperature, and wireless-radio statistics. Syslog can add DHCP, authentication, firewall, and system events.
The network-management overview from NSRC provides useful protocol context for SNMP and related management methods.
How do you set it up?
- Give the router, switch, or access point a stable management address.
- Enable SNMPv3 if the device supports it.
- If the device supports only SNMPv2c, use a long unique community string and restrict access to the monitoring host’s IP address.
- Permit SNMP only from the monitoring host and send syslog events to that host if supported.
- Add the device to a collector and confirm that interface counters change when traffic passes through.
- Record a baseline for normal bandwidth, errors, uptime, and latency before creating alerts.
Best for: managed switches, prosumer routers, OpenWrt, pfSense, OPNsense, UniFi-compatible equipment, access points, UPS units, and other devices with documented telemetry.
Cannot see: SNMP normally does not identify every client or application using an interface. Consumer hardware may expose incomplete or inaccurate sensor data.
Security note: Never expose SNMP or a monitoring dashboard directly to the public internet. Prefer SNMPv3, firewall restrictions, separate credentials, and VPN-only administrative access.
2. Is LibreNMS the best choice for router and switch monitoring?
LibreNMS is one of the strongest free and open-source choices for monitoring SNMP-capable network devices because it combines discovery, polling, interface graphs, sensors, historical data, and alerts.
The LibreNMS project repository describes LibreNMS as GPL-licensed and based on PHP, MySQL, and SNMP. The repository research snapshot listed version 26.5.1, released May 20, 2026; that version signal is volatile and should be checked against the repository and current LibreNMS documentation immediately before publication.
Windows Errors? Fix Them Before They Spread
Repair common Windows errors and clear accumulated junk for a smoother, more stable PC - no reinstall needed.Free scan · no reinstallCrashes, No Sound, or Screen Glitches?
Random freezes, missing sound and display glitches usually trace back to one bad driver. Find and replace yours safely.Free scan · under a minuteWhat is LibreNMS good at?
- Monitoring routers, managed switches, access points, UPS units, NAS devices, and other SNMP-capable equipment.
- Automatically discovering supported devices and interfaces.
- Showing historical utilization, errors, discards, uptime, and available sensors.
- Alerting when devices disappear, links fail, or measurements cross configured thresholds.
Install LibreNMS on a supported Linux host, container, or virtual machine; configure its database, web server, and scheduled polling; enable SNMP on the devices; permit the LibreNMS host as an SNMP manager; add the devices; then confirm that interfaces and sensors are being polled.
Best for: a home with several network devices and a desire for network-focused inventory and history.
Also popular on Amazon
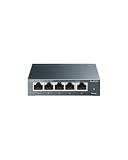
- 𝗢𝗻𝗲 𝗦𝘄𝗶𝘁𝗰𝗵 𝗠𝗮𝗱𝗲 𝘁𝗼 𝗘𝘅𝗽𝗮𝗻𝗱 𝗡𝗲𝘁𝘄𝗼𝗿𝗸: 5× 10/100/1000Mbps RJ45 Ports supporting Auto Negotiation and Auto MDI/MDIX.
- 𝗚𝗶𝗴𝗮𝗯𝗶𝘁 𝘁𝗵𝗮𝘁 𝗦𝗮𝘃𝗲𝘀 𝗘𝗻𝗲𝗿𝗴𝘆: Latest innovative energy-efficient technology greatly expands your network capacity with much less power consumption and helps save money.
- 𝗥𝗲𝗹𝗶𝗮𝗯𝗹𝗲 𝗮𝗻𝗱 𝗤𝘂𝗶𝗲𝘁: IEEE 802.3X flow control provides reliable data transfer and Fanless design ensures quiet operation.
- 𝗣𝗹𝘂𝗴 𝗮𝗻𝗱 𝗣𝗹𝗮𝘆: Easy setup with no software installation or configuration needed.
- 𝗔𝗱𝘃𝗮𝗻𝗰𝗲𝗱 𝗦𝗼𝗳𝘁𝘄𝗮𝗿𝗲 𝗙𝗲𝗮𝘁𝘂𝗿𝗲𝘀: Prioritize your traffic and guarantee high quality of video or voice data transmission with Port-based 802.1p/DSCP QoS and IGMP Snooping.
Cannot replace: a packet-level traffic analyzer. LibreNMS can show interface totals and supported flow data, but it does not automatically reveal every application or client’s traffic.
Trade-off: LibreNMS is more capable than a simple uptime monitor but more involved to install and tune. Follow the project’s current installation instructions rather than copying old commands from a blog post.
3. How does ntopng show which device is using bandwidth?
ntopng is the most traffic-focused option in this list. It analyzes packets or flow records and can show hosts, top talkers, protocols, applications, traffic direction, and bandwidth patterns.
According to the official ntopng product documentation, ntopng can use passive monitoring and flow protocols including NetFlow, IPFIX, and sFlow. The documentation also describes deployment on Linux, FreeBSD, pfSense, OPNsense, macOS, and Windows.
Why does ntopng sometimes see almost nothing?
Installing ntopng on an ordinary server connected to a normal switch port does not automatically expose all unrelated LAN traffic. The monitoring interface must receive traffic through a mirrored or SPAN port, a network TAP, exported flow records, or a gateway through which the traffic passes.
A practical deployment is to configure a managed switch to mirror the relevant VLAN or uplink to the ntopng interface. Alternatively, configure the router or firewall to export NetFlow, IPFIX, or sFlow to ntopng. The exact options depend on the equipment.
ntopng also supports active checks such as ICMP reachability, as described in its active-monitoring documentation.
Best for: finding top bandwidth consumers, investigating a saturated WAN connection, and examining protocols or unexpected traffic patterns.
Limitations: packet capture consumes resources; encrypted traffic limits payload visibility; and the free Community edition does not necessarily include every feature available in Professional or Enterprise editions. Check the current edition documentation before promising a particular capability.
Privacy: traffic metadata can reveal household activity. Protect the dashboard and set retention deliberately.
4. When should you use Prometheus, exporters, and Grafana?
Use Prometheus plus exporters and Grafana when you want flexible, long-term time-series monitoring across servers, containers, network devices, and services.
Prometheus is an open-source monitoring system and time-series database. Prometheus collects metrics and supports alerting, while Grafana provides dashboards and visualization. Grafana is not, by itself, a complete monitoring system; it needs a backend such as Prometheus, InfluxDB, Loki, Zabbix, or another data source.
Which exporters matter in a home lab?
| Component | What it checks |
|---|---|
| Blackbox Exporter | HTTP, HTTPS, DNS, TCP, ICMP, and other endpoint probes |
| SNMP Exporter | SNMP metrics from routers, switches, UPS devices, and other appliances |
| Node Exporter | Linux CPU, memory, disks, processes, and network metrics |
| Windows Exporter | Windows host metrics |
| cAdvisor | Container metrics |
A sensible beginner stack is Prometheus, Blackbox Exporter for gateway and internet checks, and Node Exporter for the monitoring host. Add Grafana after the data answers a real question, then add SNMP Exporter if the router or switch supports SNMP.
Best for: technically comfortable readers who want custom queries, dashboards, and alert rules across a mixed homelab.
Quick wins for a faster PC:
Fix the driver behind crashes, sound loss and screen glitchesFind Drivers →Repair Windows errors before they cause bigger problemsFix Now →Scan for outdated or missing drivers - takes under a minuteDriver Scan →Trade-off: Prometheus is a flexible stack rather than a one-click appliance. Exporters, scrape intervals, retention, dashboards, and alert rules all need maintenance. Prometheus is primarily a pull-based metrics system, not a packet analyzer or full log-management platform.
5. Is Zabbix suitable for an all-in-one home monitoring system?
Zabbix is suitable for a serious homelab that needs one platform for network devices, servers, virtual machines, services, discovery, historical data, triggers, dashboards, and notifications.
Zabbix supports broad infrastructure monitoring through SNMP, agents, IPMI, JMX, web checks, and custom collection methods. Its current SNMP documentation covers network-device monitoring, while its licensing information should be consulted for current license details.
Also popular on Amazon
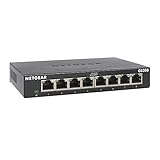
- GIGABIT ETHERNET PORTS: Features 8 x 1.0Gbps Ethernet ports for high-speed connectivity. Auto-negotiating ports detect the optimal speed for connected devices and work with existing Cat5e or Cat6 Ethernet cables.
- PLUG-AND-PLAY UNMANAGED NETWORK SWITCH: Simple plug-and-play setup with no software to install or configuration required.
- FLEXIBLE MOUNTING OPTIONS: Compact metal design supports desktop or wall-mount placement for versatile installation.
- SILENT & ENERGY-EFFICIENT OPERATION: Fanless design ensures silent performance, while IEEE 802.3az Energy Efficient Ethernet reduces power consumption without compromising high-speed network performance.
- REGIONAL COMPATIBILITY: Made for use in U.S. & CA only
Best for: a home lab with multiple servers and network devices where integrated triggers and notifications matter more than the smallest possible setup.
Do these 3 things before closing this tab:
1Fix the driver behind crashes, sound loss and screen glitches2Clear out junk files and repair common Windows errors3Scan for outdated or missing drivers - takes under a minuteStrengths: broad collection methods, strong trigger logic, discovery, templates, dashboards, and integrated alerting.
Weaknesses: Zabbix requires more administration than Uptime Kuma or Netdata and can be excessive for a single router and a few endpoints. Templates and default checks may create alert noise until they are tuned.
Choose Zabbix when you want a unified infrastructure-monitoring platform. Choose LibreNMS when the emphasis is network equipment and SNMP. Choose Prometheus when you want a highly composable metrics ecosystem.
6. Is Uptime Kuma the easiest way to get outage alerts?
Uptime Kuma is usually the easiest starting point for self-hosted availability checks. It can monitor hosts, ports, DNS services, HTTP and HTTPS endpoints, VPN services, NAS applications, game servers, and other reachable services.
The Tool Desk
Outbyte PC Repair FREEClear out junk files and repair common Windows errorsFree Scan →Outbyte Driver Updater FREEFix the driver behind crashes, sound loss and screen glitchesFind Drivers →The Uptime Kuma repository provides the project source, while the official project site documents the self-hosted monitor and notification integrations.
Best for: a Raspberry Pi, NAS, Docker host, or small server that needs a browser-configured status dashboard and alerts without assembling a metrics stack.
What it answers: “Does this endpoint respond to the check from the monitoring host?”
What it does not answer: “How much traffic is each client generating?” or “Are the router’s interfaces, memory, and error counters healthy?”
The Tool Desk
Outbyte PC Repair FREERepair Windows errors before they cause bigger problemsFix Now →Outbyte Driver Updater FREEFix the driver behind crashes, sound loss and screen glitchesFind Drivers →Run Uptime Kuma on a different host from the services being monitored, use grace periods for brief failures, configure recovery notifications, and monitor the monitoring host itself. An internal Uptime Kuma instance can prove that a local service is unreachable from inside the LAN, but it cannot independently prove that your home is unreachable from the public internet.
7. How does SmokePing diagnose latency and packet loss?
SmokePing repeatedly measures latency and packet loss and graphs the results over time, making it useful for intermittent problems that a simple up/down check misses.
The official SmokePing project and its installation documentation describe its long-term measurement and graphing approach.
Which targets should you monitor?
- The local router or default gateway.
- The first ISP hop, if you can identify it.
- A reliable public DNS resolver.
- A stable public service.
- A server or access point inside the LAN.
Comparing the graphs helps separate local Wi-Fi problems, router overload, access-link problems, upstream routing issues, and remote-service problems. For example, packet loss to the gateway suggests a local issue; clean gateway results but loss to public targets points farther upstream; loss only to one public target may be a remote-target problem.
Best for: historical WAN latency, jitter, packet-loss trends, and evidence useful when discussing recurring problems with an ISP.
Limitations: ICMP may be deprioritized or rate-limited, a single target can mislead you, and SmokePing cannot identify which device caused congestion. Use multiple targets and pair it with a traffic or interface monitor.
8. When is Netdata better than Prometheus?
Netdata is better than Prometheus when you want fast, real-time host visibility with less initial assembly. It can display CPU, memory, disks, processes, network traffic, and other operating-system metrics on the Raspberry Pi, mini PC, NAS, or server running your home services.
Netdata’s documentation covers the Agent and its dashboards, while the open-source repository provides the project source. Use the current installation documentation rather than an old command copied from another guide.
Quick wins for a faster PC:
Scan for outdated or missing drivers - takes under a minuteDriver Scan →Repair Windows errors before they cause bigger problemsFix Now →Fix the driver behind crashes, sound loss and screen glitchesFind Drivers →Also popular on Amazon
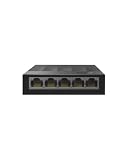
- 【One Switch Made to Expand Network】Features 5 RJ45 ports with 10/100/1000Mbps speeds, supporting Auto-Negotiation and Auto MDI/MDIX for hassle-free setup. Ideal for expanding your network, with 1 uplink (input) port and 4 output ports to split your Ethernet connection to multiple devices.
- 【Gigabit that Saves Energy】Latest innovative energy-efficient technology greatly expands your network capacity with much less power consumption and helps save money
- 【Reliable and Quiet】IEEE 802.3X flow control provides reliable data transfer and Fanless design ensures quiet operation
- 【Plug and Play】Easy setup with no software installation or configuration needed
- 【Ethernet Splitter】Connect to your router or modem for additional wired connections (laptop, gaming console, printer, etc)
Best for: answering “what is happening on my Linux box right now?” and determining whether host CPU, RAM, disk I/O, or network load is causing an apparent network problem.
Strengths: quick deployment, strong host-level charts, and immediate troubleshooting value.
Weaknesses: Netdata is not a replacement for a flow analyzer, and router support depends on the available collectors and integrations. The self-hosted Agent, cloud features, account requirements, licensing, and product boundaries have evolved; check the current documentation before making a claim about a particular feature.
9. Can Pi-hole or AdGuard Home monitor internet activity?
Pi-hole and AdGuard Home provide DNS-level visibility: they can show which clients make DNS requests, which domains are requested, which requests are blocked, and whether name resolution is failing.
Outdated Drivers Are Slowing You Down
One free scan finds every outdated or missing driver and matches the right update for your exact hardware.Free scan · exact hardware matchWindows Errors? Fix Them Before They Spread
Repair common Windows errors and clear accumulated junk for a smoother, more stable PC - no reinstall needed.Free scan · no reinstallPi-hole’s documentation explains its DNS filtering and query logging, while AdGuard Home’s official overview describes its network-wide DNS protection and visibility features.
DNS monitoring is useful for finding noisy devices, troubleshooting a device that cannot resolve names, and spotting unexpected telemetry or tracking domains. DNS logs can complement router counters, uptime checks, and flow analysis.
What can DNS logs not tell you?
- DNS logs are not a complete record of internet activity.
- Applications may use hard-coded resolvers or encrypted DNS.
- A DNS request does not prove that a connection succeeded or that a user deliberately visited a domain.
- DNS records do not show the volume of data transferred to each domain.
- One domain can support many services, content-delivery networks, or unrelated applications.
Protect the dashboard, restrict administrative access, minimize retention, and treat household DNS history as sensitive information. Pi-hole and AdGuard Home can filter and explain DNS behavior, but they are not intrusion-detection systems.
10. How can OpenWrt provide router-based monitoring?
OpenWrt is a flexible router operating system and monitoring platform rather than one monitoring application. On compatible hardware, OpenWrt can expose interface and system statistics through LuCI, collectd-compatible systems, SNMP, flow tools, or external exporters.
What’s actually slowing this PC down?
Pick the symptom - the matching free tool is one click away.
The OpenWrt documentation covers the platform, and the LuCI statistics documentation covers one route for collecting and displaying router statistics. The OpenWrt package index helps identify available packages for the relevant release and architecture.
Best for: users who want to collect WAN and LAN telemetry directly at the gateway instead of relying on a closed stock-router dashboard.
Strengths: edge-based data collection, extensive configuration, and the ability to integrate with SNMP, Grafana, LibreNMS, or other external systems.
Weaknesses: router compatibility, RAM, CPU, flash storage, package availability, firmware migration, and hardware offloading all affect the result. Installing too many packages can destabilize low-powered hardware. Traffic visibility still depends on the selected package and whether hardware acceleration bypasses the observation point.
OpenWrt is a good route when your existing router is compatible and you are comfortable maintaining firmware. It is not automatically the easiest option for a homeowner who only needs outage alerts.
Independent reader supportYour contribution helps us test, update, and keep practical guides available for everyone.Which monitoring stack should you choose first?
| If you want… | Start with… | Add later… |
|---|---|---|
| Simple outage alerts | Uptime Kuma | SmokePing |
| Historical WAN latency | SmokePing | An external probe |
| Bandwidth and top talkers | ntopng | Flow export or a mirrored port |
| Router and switch health | LibreNMS | Syslog and flow monitoring |
| One platform for a homelab | Zabbix | External availability checks |
| Flexible dashboards and queries | Prometheus plus exporters | Grafana and SNMP Exporter |
| Fast host troubleshooting | Netdata | Prometheus for longer retention |
| DNS visibility and filtering | Pi-hole or AdGuard Home | Flow monitoring |
| Router-native monitoring | OpenWrt | LibreNMS or Grafana |
| Security detection | Suricata or Zeek separately | Centralized logs and alerting |
Minimal homeowner stack
Start with Uptime Kuma for gateway, DNS, and service availability; add SmokePing for historical latency; and use Pi-hole or AdGuard Home if DNS visibility and filtering matter. This combination is relatively approachable and covers more practical questions than any one of the three alone.
Small homelab stack
Use LibreNMS for SNMP-capable network devices, Uptime Kuma for service checks, and Netdata for fast host troubleshooting. This arrangement separates network-device health, service availability, and operating-system metrics without requiring a large metrics ecosystem.
Flexible advanced stack
Use Prometheus with Blackbox Exporter, SNMP Exporter, and Node Exporter, then add Grafana for dashboards. Add ntopng separately when you need top talkers or protocol analysis. This is powerful but requires the most configuration and ongoing tuning.
Router-centric stack
Use OpenWrt statistics or compatible exporters at the gateway, send the resulting data to LibreNMS or Grafana, and add an external uptime check for public reachability. This is effective when the router is compatible and exposes the metrics you need.
Also popular on Amazon

- 𝗘𝗶𝗴𝗵𝘁 𝟮.𝟱 𝗚𝗯𝗽𝘀 𝗣𝗼𝗿𝘁𝘀 𝗳𝗼𝗿 𝗦𝘂𝗽𝗲𝗿-𝗙𝗮𝘀𝘁 𝗖𝗼𝗻𝗻𝗲𝗰𝘁𝗶𝗼𝗻𝘀: 8× 2.5-Gigabit ports unlock the highest performance of your Multi-Gig bandwidth and devices, and provide up to 40 Gbps of switching capacity.
- 𝗔𝘂𝘁𝗼-𝗡𝗲𝗴𝗼𝘁𝗶𝗮𝘁𝗶𝗼𝗻: Auto-negotiation intelligently senses the link speeds and adjusts between 3-speeds (100Mb/1G/2.5G) for compatibility and optimal performance for all your devices, including 2.5G WiFi 6 AP, 2.5G NAS, 2.5G PCIe Adapter, 2.5G Server, gaming computer, 4K video, and more.
- 𝗜𝗱𝗲𝗮𝗹 𝗳𝗼𝗿 𝗩𝗮𝗿𝗶𝗼𝘂𝘀 𝗦𝗰𝗲𝗻𝗮𝗿𝗶𝗼𝘀: Built for LAN parties, home entertainment, small and home offices, and instant transfer for workstations.
- 𝗛𝗮𝘀𝘀𝗹𝗲-𝗙𝗿𝗲𝗲 𝗖𝗮𝗯𝗹𝗶𝗻𝗴: Instantly upgrade to 2.5 Gbps without the need to upgrade to Cat6 wiring, reducing wiring costs and hassle. *
- 𝗦𝗶𝗹𝗲𝗻𝘁 𝗢𝗽𝗲𝗿𝗮𝘁𝗶𝗼𝗻: Industry-leading fanless design ensures silent operation, ideal for any home or business.
How do you troubleshoot a home-network outage with monitoring?
Use a decision sequence that moves from local connectivity to the public internet and then checks whether the monitoring system itself is trustworthy.
- Check the monitoring host. Confirm that the host has power, storage, CPU, memory, and a working LAN connection.
- Check the gateway. Can the monitoring host reach the router’s management address or default gateway?
- Check a public IP address. If the gateway responds but a public IP does not, investigate the WAN link, router, or ISP path.
- Check DNS separately. If public IP access works but domain names fail, investigate the local resolver, Pi-hole, AdGuard Home, or upstream DNS.
- Check the WAN interface. Review link status, errors, discards, uptime, and interface counters through SNMP or the router’s own dashboard.
- Compare latency targets. SmokePing or Blackbox Exporter can show whether loss occurs only over Wi-Fi, at the gateway, or farther upstream.
- Check from outside the home. An external probe distinguishes a local monitoring failure from a public reachability failure.
If a monitor sees nothing, check for a missing switch mirror, wrong SNMP version or credentials, blocked UDP 161 or syslog traffic, incomplete MIB support, or hardware offloading that bypasses the expected observation point.
If a host appears down even though its service works, test more than ICMP. A firewall may block ping while allowing TCP or HTTP; Wi-Fi client isolation may block local access; the host may be sleeping; DNS may resolve to an unreachable address; or the check interval may be too aggressive.
Free tools Windows power users keep installed
One-click scans. No signup required.
Why do monitoring graphs disagree with an ISP’s data?
Home monitoring graphs may not exactly reproduce an ISP’s billing meter because interface counters, flow records, packet captures, and provider measurements use different observation points and accounting rules.
Differences can result from traffic direction, protocol overhead, sampling, WAN-versus-LAN placement, caching, counter resets, different billing windows, and separate IPv4 and IPv6 handling. Monitoring is excellent for identifying trends and troubleshooting saturation, but it should not be treated as an exact duplicate of an ISP invoice.
How should you configure useful alerts?
Alert quality matters more than the number of dashboards. A monitor that sends notifications for every brief Wi-Fi interruption will eventually be ignored.
- Alert after three consecutive failures instead of one missed check.
- Use a grace period for services that take time to restart.
- Alert on sustained interface saturation rather than one short spike.
- Use maintenance windows for planned router, NAS, and server work.
- Group related failures so one router outage does not produce dozens of duplicate alerts.
- Separate “service down,” “device unreachable,” “high latency,” and “high utilization” into different alert classes.
- Send recovery notifications so you know when the problem ended.
- Use an alert channel that remains available when the monitored network fails.
How do security and privacy affect home-network monitoring?
Keep monitoring dashboards on the LAN or behind a VPN, use HTTPS where practical, restrict firewall access by source address, and never publish administrative interfaces directly to the internet. Use separate monitoring credentials and prefer SNMPv3 over unauthenticated or weakly protected alternatives.
Recommended Free Tools
DNS logs, flow records, packet captures, and device inventories can reveal sensitive household behavior even when payloads are encrypted. Minimize retention, protect backups, limit access to household members who need it, and document what the system records.
Packet visibility is not the same as intrusion detection. Suricata, Zeek, and Wazuh add separate security-analysis capabilities, but they also introduce additional storage, tuning, false positives, updates, and privacy considerations. Do not describe an uptime dashboard or ordinary SNMP collector as a full security-monitoring system.
What does “free” mean for self-hosted monitoring?
Free and open-source software can remove a recurring monitoring subscription, but self-hosting still has costs. You provide the hardware, electricity, storage, backups, configuration time, security updates, and replacement parts.
Hosted external monitoring has a different advantage: an independent probe can detect when the entire home connection is unreachable. Services such as UptimeRobot can be considered as a paid-or-free-tier complement, but current plan limits, retention, and pricing change and should be checked on the vendor’s site before purchase. Hosted monitoring does not automatically provide deeper visibility into devices inside the LAN.
Frequently Asked Questions
What is the best free and open-source tool to monitor a home network?
The best starting tool depends on the question. Use Uptime Kuma for simple outage and service checks, SmokePing for historical latency and packet loss, LibreNMS for SNMP-capable routers and switches, and ntopng for bandwidth and traffic visibility.
Can I monitor my whole home network from a Raspberry Pi?
A Raspberry Pi can usually run lightweight tools such as Uptime Kuma, SmokePing, Pi-hole, and modest LibreNMS or Prometheus installations. Sustained packet capture, high-rate flow processing, long retention, and several databases may require a more capable mini PC or server.
Why can’t my monitoring tool see every device’s traffic?
A normal switch port usually receives traffic addressed to the monitoring host, not all unicast traffic on the network. Per-device traffic visibility generally requires router-native accounting, NetFlow or IPFIX, a mirrored switch port, a TAP, or a monitoring host positioned directly in the traffic path.
Can Pi-hole show everything my household does online?
No. Pi-hole shows DNS requests and blocked domains, but applications can use hard-coded or encrypted DNS, and DNS requests do not prove that a connection succeeded or reveal transferred bandwidth. DNS logs are useful but incomplete and sensitive.
Can a local monitor prove that my home internet is down?
A local monitor can show that it cannot reach external targets, but it cannot independently prove public reachability when the monitoring host shares the home connection. An external probe provides a separate vantage point and can confirm whether the home is reachable from outside.
The Bottom Line
Start with the smallest tool that answers your actual question. Uptime Kuma is the practical first choice for availability, SmokePing for recurring latency, LibreNMS for SNMP network-device health, ntopng for bandwidth analysis, and Netdata for host troubleshooting. Add Prometheus or Zabbix when your homelab needs a broader monitoring platform, and remember that detailed traffic visibility depends on router, switch, and monitoring-host placement.

