
Recommended Free Tools
iTechGuides is reader-supported. When you buy through links on our site, we may earn an affiliate commission. As an Amazon Associate I earn from qualifying purchases. Learn more
HWiNFO is the best overall PC temperature monitoring tool for Windows 10 and 11 if you need detailed CPU, GPU, motherboard, storage, fan, and peripheral sensor data, along with logging, graphs, alerts, tray icons, and overlay support. For a faster and simpler overview, choose CPUID HWMonitor. For open-source software, choose Libre Hardware Monitor.
The right choice depends on what you need to monitor. Core Temp is better for CPU-only checks, GPU-Z is better for graphics-card diagnostics, Fan Control and Argus Monitor are better for temperature-based fan curves, and AMD Software or NVIDIA App are the easiest choices for gaming overlays on compatible graphics cards. This ranking reflects feature breadth, maintenance, usability, and hardware fit—not laboratory testing or a claim that one application is universally more accurate.
Research date: August 11, 2026. Hardware-monitoring software changes quickly, so verify the current version and download source before installing.
Quick picks
- Best overall: HWiNFO
- Best simple monitor: CPUID HWMonitor
- Best open-source alternative: Libre Hardware Monitor
- Best for older or simple systems: Open Hardware Monitor
- Best for fan control: Argus Monitor or Fan Control
- Best CPU-only monitor: Core Temp
- Best paid enthusiast suite: AIDA64 Extreme
- Best for NZXT hardware: NZXT CAM
- Best for Corsair hardware: Corsair iCUE
- Best native AMD overlay: AMD Software: Adrenalin Edition
- Best native NVIDIA overlay: NVIDIA App
- Best GPU specialist: GPU-Z
Top 15 PC temperature monitoring tools
The table shows each utility’s strongest use case, the kinds of sensors it can expose, whether it supports logging or an in-game overlay, and whether it can control fans. Coverage still depends on the motherboard, processor, graphics card, firmware, drivers, and sensor backend.
Popular on Amazon
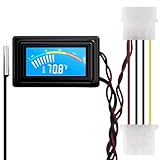
- 【4 Pin Interface】4 pin power supply interface, easy to install. Designed for PC car use. you can also use 2 PIN to connect the power supply only.
- Accurate and Responsive】Temperature Measurement Range: -58°F to 230°F /-50°C to 110°C. Sensitivity: ±0.05s. Accuracy: ±0.5°F/±0.5°C. Working Voltage: DC 4 to 25V. Sensor cable: 1 meter, Temperature display unit: °C/°F Convertable.
- 【NTC 10K sensor waterproof】With stainless waterproof NTC probe, this aquarium temperature gauge have great sensitivity and accuracy. Measurement interval: 0.25s.
- 【Wide Applications】This computer thermometer is widely used in car water temperature detection, air conditioning, refrigerator, water heater temperature detection, computer chassis temperature detection, etc.
- 【Color Liquid Crystal Display】This digital thermomters with probe is equipped with backlight display, which is fairly easy to check the temperature even in the dark.
| Rank | Software | Best use | Typical coverage | Logging or overlay | Fan control | Windows and access notes |
|---|---|---|---|---|---|---|
| 1 | HWiNFO | Deep whole-PC monitoring and diagnostics | CPU, GPU, motherboard, VRM, drives, memory modules, batteries, and peripherals | Detailed logging, graphs, alerts, tray icons, OSD, and third-party interfaces | Primarily monitoring; integrates with other control tools | Windows through Windows 11; active 2026 development |
| 2 | CPUID HWMonitor | Fast, readable system snapshot | CPU and GPU temperatures, clocks, load, power, voltage, current, fans, memory modules, SMART drives, and batteries | Basic monitoring; less customization than HWiNFO | Generally monitoring rather than advanced control | Windows x86, x64, and ARM64 builds |
| 3 | Libre Hardware Monitor | Actively maintained open-source monitoring | CPU, GPU, motherboard, fans, voltages, HDDs, SSDs, NVMe drives, and network cards | Monitoring and sensor display; capabilities depend on the backend | Not its primary purpose | Open source; release activity continued into 2026 |
| 4 | Open Hardware Monitor | Lightweight monitoring on older or simpler PCs | CPU cores, GPUs, SMART drives, voltages, fans, load, and clocks | Main window, desktop gadget, and system-tray display | No advanced fan-control focus | Open source; official site lists version 0.9.6 from December 27, 2020 |
| 5 | Argus Monitor | Monitoring combined with sophisticated fan control | CPU cores, GPU, hard drives, SMART health, and fans | Graphs and monitoring dashboards | Temperature-based curves for GPU and mainboard fans | Windows 10 22H2 and Windows 11; fully functional 30-day evaluation, then a license is required |
| 6 | Core Temp | Small CPU-temperature tray utility | Processor-core temperatures and related CPU readings | Simple real-time and tray monitoring | No whole-system fan-control focus | Windows; verify the current release on the canonical ALCPU site |
| 7 | AIDA64 Extreme | Paid monitoring, inventory, diagnostics, and stress testing | More than 250 real-time sensors, including CPU, GPU, board, drive, and fan data | Logging, OSD, tray display, external displays, graphs, and SensorPanel dashboards | Monitoring and extensive customization; not primarily a fan controller | Paid enthusiast suite for Windows 10 and 11 |
| 8 | Fan Control | Custom temperature-based fan curves | CPU, GPU, motherboard, hard-drive, and other available temperature sources | Profiles, mixed sensor curves, hysteresis, and low resource use | Its main purpose; uses Libre Hardware Monitor as the primary sensor backend | Windows 10 and 11; laptop compatibility can be limited |
| 9 | NZXT CAM | Accessible dashboard and NZXT-device control | CPU, GPU, memory, storage, temperatures, and utilization | Temperature graphs and desktop Mini Mode | NZXT fans, coolers, RGB devices, and Kraken LCD hardware | Works on a Windows PC without NZXT hardware or an account; compatible hardware adds controls |
| 10 | Corsair iCUE | Monitoring in a Corsair-centered system | CPU, GPU, motherboard, load, and temperature readings | Dashboard views and monitoring displays | Strongest with Corsair coolers, fans, controllers, and RGB devices | Monitoring features are available even without iCUE-enabled hardware |
| 11 | AMD Software: Adrenalin Edition | Native Radeon gaming metrics and overlay | GPU current and junction temperature, fan speed, utilization, power, CPU utilization, and CPU temperature | Real-time and logged metrics, including an in-game overlay | GPU-related controls vary by supported hardware and driver | Requires compatible AMD Radeon hardware and a full software installation |
| 12 | NVIDIA App | Native NVIDIA gaming-performance overlay | Primarily GPU performance and temperature information | Real-time in-game overlay metrics | Not a complete motherboard or system fan controller | Requires compatible NVIDIA graphics hardware and the current NVIDIA software ecosystem |
| 13 | Speccy | Simple hardware summary with live temperatures | Basic system hardware details and temperature readings | Live monitoring; fewer advanced controls | No advanced fan-control focus | Windows 10 and 11; 32-bit and 64-bit versions |
| 14 | GPU-Z | Graphics-card identification and sensor checks | GPU temperature, clocks, memory, BIOS, and driver details | GPU-focused sensor information | Not a complete system fan controller | Use a verified TechPowerUp source and check the current build |
| 15 | MSI Afterburner with RTSS | GPU tuning, fan curves, and gaming OSD | GPU temperatures, clocks, utilization, and related graphics metrics | In-game OSD when paired with RivaTuner Statistics Server | GPU-focused fan curves | Verify the current release, Windows support, and distribution source before installing |
1. HWiNFO: best overall
HWiNFO is the strongest choice when you want to investigate a thermal problem rather than merely glance at one temperature. Its sensor view can expose data from the processor, graphics card, motherboard, storage devices, memory modules, batteries, and other peripherals. It also supports logging, graphs, alerts, tray icons, on-screen display output, and interfaces used by other monitoring applications.
That breadth is especially useful for diagnosing patterns: a CPU package temperature that rises during a workload, a GPU hotspot that is much higher than its edge temperature, an NVMe drive that heats up during transfers, or a case-fan response that does not match the temperature source. HWiNFO’s active 2026 development also includes newer GPU hotspot and VRAM-temperature support.
The main drawback is interpretation. HWiNFO may show several readings for what a beginner thinks is one component. CPU core, CPU package, motherboard, VRM, GPU edge, GPU hotspot, GPU junction, SSD controller, and drive-temperature readings are different sensors in different locations. The most prominent number is not automatically the most important one.
PC Slower Than It Used to Be?
A free scan shows the junk files, broken settings and background clutter dragging Windows down - then fixes them in one click.Free scan · Windows 10 & 11Outdated Drivers Are Slowing You Down
One free scan finds every outdated or missing driver and matches the right update for your exact hardware.Free scan · exact hardware matchChoose it if: you want the broadest sensor inventory, historical logs, alerts, or compatibility with other monitoring and overlay tools.
2. CPUID HWMonitor: best simple all-rounder
HWMonitor is easier to scan than HWiNFO and covers the readings most people want first: CPU and GPU temperatures, voltage, power, current, fan speed, utilization, and clocks. It can also show memory-module sensors, SMART-drive temperatures, and battery readings where the hardware exposes them.
It is a good first installation for checking whether a PC is broadly behaving as expected. The trade-off is less customization and diagnostic depth. CPUID provides Windows x86, x64, and ARM64 versions, so choose the build that matches the system rather than assuming every Windows installation should use the same package.
Choose it if: you need a quick whole-PC snapshot and do not want to sort through a large list of duplicate or low-level sensors.
Quick wins for a faster PC:
Clear out junk files and repair common Windows errorsFree Scan →Fix the driver behind crashes, sound loss and screen glitchesFind Drivers →3. Libre Hardware Monitor: best open-source alternative
Libre Hardware Monitor is the most compelling open-source choice for modern systems. Its official project lists support for temperatures, fan speeds, voltages, load, clocks, motherboards, Intel and AMD processors, NVIDIA, AMD and Intel graphics cards, HDDs, SSDs, NVMe drives, and network cards. Development and release activity continued into 2026.
It is a better default than Open Hardware Monitor for many newer PCs because the project is actively maintained. However, support is not guaranteed simply because a component is listed. A motherboard may expose some sensors but not others, and a sensor may require elevated privileges or a particular backend. If the output is incomplete, that does not necessarily mean the component is overheating—or that the software is defective.
Choose it if: open-source licensing and active development matter more than the polished breadth and integrations of HWiNFO.
4. Open Hardware Monitor: best lightweight option for older PCs
Open Hardware Monitor remains useful on older or uncomplicated systems. It can read CPU-core, GPU, SMART-drive, voltage, fan, load, and clock sensors, then display them in its main window, a desktop gadget, or the system tray.
Its important limitation is maintenance. The official site lists version 0.9.6, released December 27, 2020. That does not make it unusable, but it makes it a weaker first choice for very recent CPUs, GPUs, motherboards, and NVMe devices. Libre Hardware Monitor or HWiNFO is more likely to understand newer sensor implementations.
Choose it if: you want a lightweight open-source monitor for an older or well-supported PC and do not need current-hardware coverage or advanced controls.
Also popular on Amazon
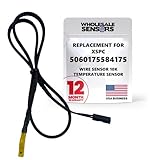
- PERFECT OEM REPLACEMENT: Upgrade your custom liquid cooling setup with this direct aftermarket replacement engineered to meet or exceed original equipment manufacturer specifications. This premium 10K ohm NTC thermistor provides identical form, fit, and function to the original part, resolving issues from faulty readings. It serves as a drop-in replacement for part number 5060175584175, ensuring complete systemic compatibility with your existing thermal management equipment.
- UNIVERSAL HARDWARE COMPATIBILITY: Designed for seamless integration with high-end PC water cooling loops and monitoring infrastructure. This temperature sensor connects directly to 2-pin 10k motherboard headers from top brands like ASUS, MSI, and Gigabyte. It is fully compatible with Corsair Commander Pro, Aqua Computer Aquaero, XSPC V2 LCD Display Modules, and standalone digital fan controllers, making it the top choice for performance enthusiasts seeking accurate data.
- PREMIUM DURABILITY AND RIGOROUS TESTING: Built with premium materials to ensure lasting durability and exceptional thermal sensitivity. Each flat sensor element undergoes rigorous performance and reliability testing to guarantee accurate, real-time temperature tracking under intense thermal loads. The 50cm (21.5-inch) flexible cable features a high- density black sleeve that protects internal wiring from wear while blending perfectly into clean, professional PC builds.
- EFFORTLESS INSTALLATION AND TROUBLESHOOTING: Simply mount the flat sensor element to water blocks, reservoirs, or radiator fins and plug the standard 2-pin female connector into your header. This quick-apply component eliminates erratic fan behavior, system thermal shutdowns, and bios temperature error codes caused by failing stock probes. It allows your software to accurately map dynamic fan curves and pump speeds based on actual coolant or ambient case temperatures.
- TRUSTED USA SUPPORT AND WARRANTY: Choose Wholesale Sensors for dependable quality backed by an American business. Every purchase includes an industry-leading 12-month replacement warranty to give you complete peace of mind. Our dedicated, USA-based product support team is always ready to assist you with installation troubleshooting or compatibility questions, ensuring a premium, risk-free customer experience from a brand that stands firmly behind its products.
5. Argus Monitor: best monitoring plus fan control
Argus Monitor combines temperature and fan monitoring with more sophisticated control than most diagnostic utilities. It can track CPU cores, GPU temperature, hard-drive temperatures, SMART health warnings, and fan behavior, then use temperature-based curves to control compatible GPU and mainboard fans.
The official product documentation lists Windows 10 22H2 and Windows 11 support. Its evaluation is fully functional for 30 days; after that, a license is required. That makes it a practical way to test whether its controls work with a particular motherboard and graphics card before paying.
The Tool Desk
Outbyte PC Repair FREEClear out junk files and repair common Windows errorsFree Scan →Outbyte Driver Updater FREEScan for outdated or missing drivers - takes under a minuteDriver Scan →Choose it if: your main goal is quiet, responsive, temperature-based fan behavior and you prefer an integrated interface. It is less compelling if you only need a few temperature numbers.
6. Core Temp: best CPU-only monitor
Core Temp is intentionally narrow. It focuses on real-time processor-core temperatures and is useful as a small tray utility when you do not need GPU, storage, motherboard, or peripheral monitoring.
Third-party listings identify Windows 11 support and version 1.19.5, but the canonical ALCPU site should be treated as the authority for the current release and download. Do not use an old mirror merely because it displays a familiar version number.
Choose it if: you are troubleshooting CPU temperature only and want the least distracting interface in this list.
Free tools Windows power users keep installed
One-click scans. No signup required.
7. AIDA64 Extreme: best paid enthusiast suite
AIDA64 Extreme is substantially more than a temperature reader. FinalWire describes more than 250 real-time sensors, while the suite also provides hardware inventory, diagnostics, benchmarks, stress testing, logging, OSD output, tray monitoring, external-display support, and customizable SensorPanel dashboards.
Its documentation covers practical details that matter to enthusiasts, including Fahrenheit display, CPU-throttling measurement, disk-temperature measurement, logging, and configurable handling of Tjmax. That makes it useful when you want a polished dashboard for a desk display or a repeatable diagnostic and stress-testing workflow.
The downside is cost and complexity. AIDA64 Extreme is a paid Windows 10/11 enthusiast suite, so it is difficult to justify if all you need is a quick CPU-temperature check.
Choose it if: monitoring is part of a larger hardware-inventory, benchmarking, stress-testing, or custom-dashboard workflow.
8. Fan Control: best for custom fan curves
Fan Control is primarily a fan-management application, not a general-purpose diagnostic dashboard. It can build curves from CPU, GPU, motherboard, hard-drive, and other available temperature sources. Profiles, mixed sensor curves, hysteresis, and low resource use make it suitable for quiet desktop configurations that need more control than a BIOS fan curve provides.
Its primary sensor backend is Libre Hardware Monitor, so the quality and availability of the controls depend on what the system exposes through that backend. Laptop compatibility is a major limitation: many laptops do not expose controllable fans to third-party software, even when temperatures can be read.
Software cannot compensate for blocked airflow, a failing fan, an inadequate cooler, or an incorrectly wired hub. Desktop builders who need more headers may consider a PC fan controller, but they must distinguish a powered PWM hub—which often mirrors one control signal—from a controller that independently manages multiple fan groups.
Also popular on Amazon
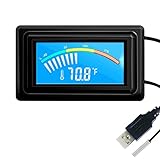
- 【USB Power Supply】This digital thermometers is use usb connector as power supply. Easily to connect to PC, laptop computer, power bank, usb socket or any other usb port.
- 【Accurate and Responsive】Temperature range: -58°F to 230°F /-50°C to 110°C, Input: DC 4~25V, Size: 4.7 x 2.8 x 1.7cm / 1.9" x 1.1" x 0.7", 50 Grams, Sensor cable: 1 meter, Temperature display unit: °C/°F switchable.
- 【NTC 10K sensor waterproof】This digital PC thermometer is responsive and accurate to measure the temperature. Measurement interval: 0.25s, accuracy: ±0.5°C/±0.5°F.
- 【Wide Applications】This thermometer gauge with probe is widely used in managing aquarium, pets, vehicle, air conditioning, refrigerator, freezer, water heater, greenhouses, Incubators, computer chassis temperature detection, DIY, etc.
- 【Color Liquid Crystal Display】This aquarium thermomter digital is equipped with bright backlight, you can clearly check the temperature even in the dark.
Choose it if: you want to design and save custom temperature-based fan behavior on a compatible desktop PC.
Do these 3 things before closing this tab:
1Repair Windows errors before they cause bigger problems2Scan for outdated or missing drivers - takes under a minute3Clear out junk files and repair common Windows errors9. NZXT CAM: best for NZXT hardware and accessible dashboards
NZXT CAM is visually approachable and useful even if the PC has no NZXT hardware or the user does not create an account. It provides CPU, GPU, memory, and storage readouts, temperature graphs, utilization tracking, and a desktop Mini Mode.
Its value increases substantially in an NZXT system. Compatible fans, coolers, RGB devices, and Kraken LCD hardware can add device control, lighting management, and display configuration. Outside that ecosystem, CAM is mainly a friendly dashboard rather than the deepest sensor diagnostic tool.
Choose it if: you want an easy dashboard or already use NZXT cooling, RGB, or Kraken hardware.
10. Corsair iCUE: best for Corsair-centered systems
Corsair iCUE provides CPU, GPU, motherboard, load, and temperature readouts through dashboard views. Corsair documents those monitoring features as available even without iCUE-enabled hardware, so the application is not restricted to Corsair owners for basic system readings.
Its strongest reason to install it is an existing Corsair ecosystem: coolers, fans, controllers, RGB devices, and compatible peripherals. If the PC uses mixed-brand components and the goal is detailed sensor investigation, HWiNFO or HWMonitor will usually be a more focused choice.
Choose it if: Corsair hardware is already responsible for your cooling, lighting, or device management.
11. AMD Software: Adrenalin Edition: best native AMD overlay
AMD Radeon owners can use AMD Software: Adrenalin Edition for real-time and logged metrics without installing a separate hardware monitor. AMD documents GPU current temperature, GPU junction temperature, fan speed, utilization, power, CPU utilization, CPU temperature, and other performance readings.
This is especially convenient for gaming because the metrics can appear in an in-game overlay. It is not a universal replacement for HWiNFO: availability depends on compatible Radeon hardware and a full installation, and it is centered on AMD’s graphics and driver ecosystem rather than every motherboard, storage, and peripheral sensor.
What’s actually slowing this PC down?
Pick the symptom - the matching free tool is one click away.
Choose it if: you use a compatible Radeon GPU and mainly want gaming performance and thermal telemetry in the AMD overlay.
12. NVIDIA App: best native NVIDIA overlay
NVIDIA App is the natural choice for NVIDIA GPU users who primarily need real-time gaming statistics. NVIDIA documents overlay metrics and GPU-temperature reporting through its current software ecosystem.
It is more GPU- and game-overlay-oriented than a complete PC sensor inventory. It will not replace a tool such as HWiNFO when you need detailed CPU, motherboard, storage, fan, or VRM information.
Choose it if: your priority is a low-friction NVIDIA gaming overlay rather than whole-system troubleshooting.
Also popular on Amazon

- ✅【4 Channels Thermometer Data logger】4 channels thermometer main unit can record 5000 groups temperature, and unlimited data storage when connect to software in PC
- ✅【Wide Measurement Range】The man unit of thermometer measuring range is: -328~2501degreeF (-200~1372degreeC); Range of K type thermocouples: -58~572degreeF(-50~300degreeC)
- ✅【Audible&Visible Alarm】Manually set the upper and lower alarm thresholds. The light indicator will flash and sound will beep when the testing value is higher or lower than the set thresholds
- ✅【Multi-Functional】: HD large screen display, degreeF/degreeC & K/J switchable, multi sampling rates, Max/Min/Average, Data Hold, Auto power-off function(can be cancelled manually)
- ✅【ADJ temperature compensation】Long press ADJ button, then adjust the ADJ Temperature compensation value to complete the calibration procedure, ADJ compensation range: -16~48degreeF (-9~9degreeC)
13. Speccy: best quick hardware summary
Speccy combines a readable hardware summary with live temperature monitoring. Its product information lists Windows 10/11 compatibility and 32-bit and 64-bit versions, making it approachable for casual users who want to identify the major components and see basic temperatures in one place.
It offers less current technical depth and fewer advanced monitoring controls than HWiNFO, HWMonitor, or Libre Hardware Monitor. Download carefully from the publisher’s legitimate product page; unofficial download sites may bundle unwanted software.
Choose it if: you want a simple hardware inventory with live temperature information and do not need detailed sensor analysis.
14. GPU-Z: best GPU specialist
GPU-Z is designed for graphics-card investigations. It can help identify the GPU and inspect GPU temperature, clocks, memory, BIOS, and driver information. That makes it useful when diagnosing a graphics-card issue or confirming exactly which GPU and memory configuration a system has.
It should not be presented as a complete CPU, motherboard, storage, or whole-PC temperature monitor. Current GPU-Z builds are demonstrated through TechPowerUp validation pages and Windows 10/11 environments, but the main product page was not verifiable in the research pass. Use a verified TechPowerUp source and confirm the current build before downloading.
Choose it if: the question is specifically about a graphics card rather than the thermal behavior of the entire PC.
15. MSI Afterburner with RTSS: best-known GPU gaming monitor and OSD
MSI Afterburner is a familiar GPU-focused utility for monitoring, tuning, fan curves, and on-screen statistics. When paired with RivaTuner Statistics Server, it can place GPU and performance data in a game overlay.
It is a reasonable option for GPU-focused readers, but the current release, Windows support, and official distribution details were not sufficiently verifiable in this research pass. Treat download-source verification as mandatory and do not confuse a popular mirror with an official publisher channel.
Quick wins for a faster PC:
Scan for outdated or missing drivers - takes under a minuteDriver Scan →Clear out junk files and repair common Windows errorsFree Scan →Choose it if: you want GPU tuning and an established gaming OSD, and you are prepared to verify the current distribution source.
How to choose the right monitor
Choose by the problem you are trying to solve
- Checking whether the whole PC is overheating: start with HWiNFO, HWMonitor, or Libre Hardware Monitor.
- Checking only the processor: use Core Temp or HWiNFO.
- Checking only a graphics card: use GPU-Z, AMD Adrenalin, NVIDIA App, or MSI Afterburner with RTSS.
- Investigating a hard drive or NVMe drive: use HWiNFO, HWMonitor, Libre Hardware Monitor, or AIDA64.
- Recording temperatures over time: choose HWiNFO, AIDA64, AMD Adrenalin, or a tool with documented logging support.
- Building custom desktop fan curves: choose Fan Control or Argus Monitor.
- Managing RGB, a cooler, or an LCD screen: use the matching NZXT CAM or Corsair iCUE ecosystem.
- Monitoring an older PC: Open Hardware Monitor may be sufficient, but test sensor coverage before relying on it.
Choose by complexity and licensing
Free or open-source does not automatically mean more accurate, and a paid application does not automatically support every sensor. Libre Hardware Monitor and Open Hardware Monitor are open-source projects. Argus Monitor offers a fully functional 30-day evaluation and requires a license afterward. AIDA64 Extreme is a paid suite. For the remaining utilities, check the publisher’s current edition and license terms because software packaging and availability can change.
Vendor applications are often the best way to control matching hardware, but they can be unnecessary background software if you only need temperatures. Independent tools generally provide a broader view across mixed-brand components.
Independent reader supportYour contribution helps us test, update, and keep practical guides available for everyone.How to use temperature-monitoring software correctly
- Download from the publisher or verified project repository. Avoid search-result advertisements, repackaged installers, and unofficial mirrors. This is particularly important for smaller utilities and GPU-tuning software.
- Install only the features you need. If HWiNFO offers a sensor-only launch, use it when you do not need the hardware inventory window. A vendor suite may be unnecessary if you are not controlling its hardware.
- Record an idle baseline. Let Windows settle for several minutes, then note the CPU package or core readings, GPU readings, storage temperature, fan speeds, and room or case conditions if available.
- Reproduce the problem. Run the application or workload that causes the slowdown, noise, crash, or performance drop. Watch both the current and maximum values; a brief spike is not the same as a temperature sustained for the entire workload.
- Log the result when the problem is intermittent. HWiNFO and AIDA64 are especially useful for recording values over time. A log can show whether the temperature rises first, whether the fan responds, and whether clocks or utilization change afterward.
- Compare questionable readings. If a value is missing or implausible, check it with a second current utility and compare it with the CPU or GPU manufacturer’s published thermal specifications before changing fan settings or replacing parts.
How to interpret the numbers
There is no single temperature number that represents the entire PC. A CPU package reading, individual core readings, a GPU edge temperature, a GPU hotspot or junction temperature, a motherboard or VRM sensor, an SSD controller reading, and an ambient sensor describe different physical locations.
Free tools Windows power users keep installed
One-click scans. No signup required.
Do not average unrelated sensors or treat the highest number in a long list as automatically dangerous. Look for a sustained pattern under a known workload, then use the component manufacturer’s specifications to decide whether the reading is within the intended operating range. Monitoring software reports what the hardware, firmware, drivers, and sensor libraries expose; it does not turn an unavailable sensor into a measured one.
Also popular on Amazon

- NTC 10K high-accuracy temperature sensor, measuring temperature range: -30°C to +105°C (-22°F to +221°F)
- Copper waterproof probe, 5mm dia 25mm length, fast temperature conduction
- 400mm(15.7 inch) wire length, XH2.54-2P plug
- Widely Application for Household Appliances: Air conditioner, refrigerator, freezer, water heater, air heater, dishwasher, dryer,etc.
- Widely Application in Temperature Control System: Greenhouse, aquarium, etc.
What to do when a reading is missing or wrong
- Only some sensors appear: the hardware may not expose those sensors, or the current application may not support the motherboard’s embedded-controller implementation. Try HWiNFO or Libre Hardware Monitor as a second source.
- The reading is obviously implausible: update the utility from its official source, check firmware and driver changes, and compare with another current utility. Do not change cooling based on one unexplained number.
- Values appear duplicated: examine the sensor names and locations. HWiNFO may show multiple sensors that are valid but measure different points or use different vendor definitions.
- Running as a normal user shows less data: some sensor backends require elevated privileges. Libre Hardware Monitor specifically notes that privileges and backend availability can affect sensor coverage.
- Virtualization or security settings affect results: system configuration, firmware changes, virtualization, and security features can prevent an application from accessing particular sensors.
- Fan speed is visible but cannot be controlled: monitoring and control are separate capabilities. The motherboard, GPU, embedded controller, header, or laptop firmware may not permit third-party control.
- A laptop fan curve does not work: this is common. Many laptops do not expose controllable fans to third-party software, so use the manufacturer’s utility or firmware controls instead.
When monitoring points to a physical cooling problem
A monitoring application can identify a symptom, but it cannot repair a poor cooler mount, blocked airflow, a failing fan, or degraded thermal interface material. First remove dust, confirm that every fan spins, check that intake and exhaust paths are not obstructed, and verify that the cooler is mounted correctly.
If you remove and reinstall a CPU cooler, use compatible CPU thermal paste rather than reusing contaminated or dried compound. Thermal paste is not automatically the solution to every high-temperature problem, and applying more paste will not fix an undersized cooler or poor case airflow.
If the CPU remains hot during sustained load after mounting and airflow checks, consider a compatible CPU cooler only after checking the processor socket, case height or radiator clearance, motherboard layout, and mounting hardware. For desktop systems with excessive case or motherboard temperatures, compatible 120mm PC case fans may improve airflow, but confirm the fan size, PWM or DC connector, header limits, noise target, and direction of airflow first.
Disclosure: Product-category references may be eligible for affiliate links. They are included only as possible remedies after diagnosis; the monitoring software itself does not prove that a replacement part is needed.
Safe fan-control practices
Fan Control and Argus Monitor can make a desktop quieter, but a poorly chosen curve can allow temperatures to rise or cause fans to cycle constantly. Change one control at a time, preserve a sensible minimum speed, use hysteresis or a delay where available, and test the profile under the heaviest normal workload.
Watch the physical result as well as the software value. Confirm that the fan actually accelerates when the selected sensor crosses the curve and that the selected temperature source reflects the component you are protecting. Save a conservative profile and know how to disable the utility or return to BIOS or vendor control if the application fails.
Official-source and currentness checklist
- Use HWiNFO’s official publisher site for HWiNFO.
- Use CPUID for HWMonitor.
- Use the official Libre Hardware Monitor repository for that project.
- Use Open Hardware Monitor’s official site, while remembering that its listed release is from 2020.
- Use Argus Monitor’s official documentation and product site.
- Verify Core Temp through the canonical ALCPU site rather than relying on a third-party version listing.
- Use FinalWire for AIDA64 and the official Fan Control release repository for Fan Control.
- Use NZXT, Corsair, AMD, and NVIDIA for their respective vendor applications.
- Use the publisher’s product page for Speccy and a verified TechPowerUp source for GPU-Z.
- For MSI Afterburner, verify the current official release and distribution details before publication or installation.
Windows compatibility and software features can change independently of hardware generations. The ranking above reflects the research timestamp of August 11, 2026; refresh version numbers, download links, supported hardware, overlay behavior, and bundled components if this guide is reused later.
Frequently Asked Questions
What is the best PC temperature monitoring software for Windows 11?
HWiNFO is the best overall choice for Windows 11 because it offers the broadest sensor coverage, logging, graphs, alerts, tray icons, OSD support, and integrations. Choose HWMonitor instead if you want a simpler display, or Core Temp if you only need CPU-core temperatures.
Is HWMonitor better than HWiNFO?
Neither is universally better. HWMonitor is easier for a quick whole-PC snapshot, while HWiNFO provides more sensors, customization, logging, alerts, graphs, and diagnostic detail. Use HWMonitor for simplicity and HWiNFO for investigation.
Which temperature monitor is best for gaming?
AMD Radeon users can start with AMD Software: Adrenalin Edition, and NVIDIA users can use NVIDIA App for native gaming overlays. MSI Afterburner with RTSS is another GPU-focused option. For a complete CPU, GPU, motherboard, and storage view, use HWiNFO alongside the gaming overlay.
Why does my monitoring software show several CPU or GPU temperatures?
Those values may come from different physical locations or sensor definitions. CPU core and package readings, GPU edge and hotspot or junction readings, and SSD controller and drive readings are not interchangeable. Compare like-for-like readings and check the component manufacturer’s specifications.
Recommended Free Tools
Can temperature-monitoring software control laptop fans?
Sometimes, but compatibility is limited. Many laptops do not expose controllable fans to third-party applications even when temperatures are readable. Fan Control and Argus Monitor are more suitable for compatible desktops; laptop users may need the manufacturer’s utility or firmware controls.
Do I need new thermal paste or a new cooler if temperatures are high?
Not automatically. Confirm the reading with a second current utility, check the manufacturer’s thermal specifications, inspect dust and airflow, and verify the cooler mount first. Thermal paste may help after a cooler is removed and reinstalled, while a new cooler requires socket, clearance, and workload compatibility checks.
The Bottom Line
Install HWiNFO for the most complete Windows 10/11 temperature and sensor investigation. Pick HWMonitor for a simpler snapshot, Libre Hardware Monitor for an actively maintained open-source option, Core Temp for CPU-only monitoring, and Fan Control or Argus Monitor when fan curves are the real objective. Treat every reading as hardware-reported data, verify suspicious values, and change cooling hardware only after diagnosing the physical cause.

