py-spy
py-spy: A focused, open-source CPU profiler for inspecting live Python processes with minimal overhead. Ranked #20 of 28 in Profiling Software by our editors (7.9/10); pricing: Open source; best for low-overhead Python CPU profiling.
At a glance
- Editor score7.9 / 10
- PricingOpen source
- Best forLow-overhead Python CPU profiling
- Paid fromFree
- Profiling modesSampling
- Facts checked20 Sep 2026
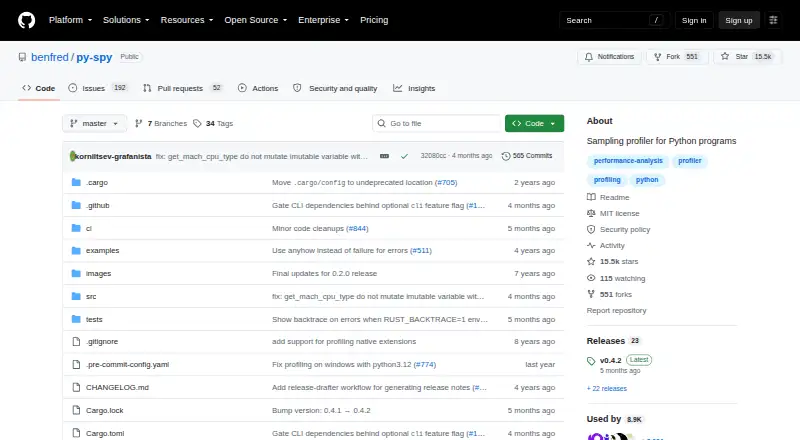
Where it wins
- Profiles running Python programs without code changes or restarts
- Generates interactive flame graphs, speedscope files, and raw data
- Inspects threads, native extensions, subprocesses, and GIL activity
Where it doesn't
- Does not provide verified memory profiling
- Uses sampling rather than broader profiling modes
- Primarily targets Python programs and Python execution paths
Our verdict on py-spy
py-spy is an open-source command-line sampling profiler for Python programs. It attaches to running processes or launches programs for profiling without requiring code changes or process restarts. Its desktop deployment supports Windows, macOS, and Linux, with CPython support across those platforms and FreeBSD. The tool is aimed at developers who need to understand CPU usage, thread activity, or slow execution paths without modifying the application being profiled.
Its main strength is the breadth of inspection available from a sampling profiler. py-spy runs outside the profiled Python process with low overhead, then records results as interactive SVG flame graphs, speedscope files, or raw data. A live top view shows functions consuming time, while thread call-stack dumps expose activity across Python threads. GIL-focused filtering and thread activity inspection add useful detail for diagnosing contention. Local variables associated with stack frames can also be displayed, and native mode extends profiling to selected C, C++, and Cython extensions.
The tool is a focused choice rather than a broad profiling suite. Subprocess profiling includes child processes, which helps when work is distributed across launched processes, but the core scope remains Python CPU profiling through sampling. It does not provide verified memory profiling, so teams investigating allocation behavior or memory growth should choose a product designed for that purpose instead. py-spy fits developers who want an open-source, low-overhead view of running Python programs and prefer command-line workflows; it is less suitable when memory analysis or profiling modes beyond sampling are central requirements.
Your product? Our editors can test py-spy in depth and publish a review, labelled as paid · from $149/mo →
py-spy pricing
py-spy fact sheet
| Free plan | Not verified |
|---|---|
| Paid from | Free |
| Profiling modes | Sampling |
| Supported languages | Python; C; C++; Cython |
| CPU profiling | Yes |
| Memory profiling | Not verified |
| Thread profiling | Yes |
| Deployment model | Desktop |
| Deployment | Desktop |
| Platforms | Windows, macOS, Linux |
| Support | Community, Docs |
| Built for | Solo, Small business, Mid-market, Enterprise (editorial estimate) |
| Pricing | Open source |
| Website | github.com |
| Facts checked | 20 Sep 2026 |
Alternatives to py-spy
- Intel VTune ProfilerA free profiler covering CPU, memory, threading, GPU/NPU, I/O, MPI, and OpenMP.9.4
- AMD uProfA free AMD-focused profiler with broad CPU, system, threading, power, GPU, and tracing analysis.9.2
- PyroscopeA flexible profiler for teams that need continuous CPU and memory visibility at scale.9.1


Used py-spy? Be the first to review it
The editor score above is our own research. What this page doesn't have yet is a reader's view — what you used py-spy for, what worked and what didn't. No stars are seeded and no review is paid for; an editor reads every one before it appears.
Write a reviewTwo minutes · verified accounts only · read by an editor before it appears
Featured on iTechGuides

py-spy is listed in our Profiling Software directory. Add the badge to your site — it links back to this page.
<a href="https://www.itechguides.com/products/py-spy/"><img src="https://www.itechguides.com/best/badge/py-spy.svg" alt="Featured on iTechGuides" width="230" height="46"></a>
Reviewed by iTechGuides Editors · Editorial team · Updated Oct 2026
Advertiser disclosure: iTechGuides is reader-supported. Vendors can pay for top positions in our rankings and for a place on other products' pages, and we may earn a commission when you click some links. Bought places stand at the number bought; this page and our disclosure say so. Paying vendors may get a fuller, more detailed review from our editors, and that review can change their score. How we rank.
Last updated · How we research and update