
Intel VTune Profiler
Intel VTune Profiler: A free profiler covering CPU, memory, threading, GPU/NPU, I/O, MPI, and OpenMP. Ranked #1 of 28 in Profiling Software by our editors (9.4/10); pricing: Free plan; best for free, broad systems and application profiling.
At a glance
- Editor score9.4 / 10
- PricingFree plan
- Best forFree, broad systems and application profiling
- Free planYes
- Paid fromFree
- Profiling modesBoth
- Facts checked20 Sep 2026
Where it wins
- Covers CPU, memory, threading, GPU/NPU, I/O, MPI, and OpenMP analysis
- Supports GUI and command-line workflows on Windows and Linux
- Works with many languages, IDEs, containers, and virtualized environments
Where it doesn't
- Desktop deployment limits it to local Windows or Linux host workflows
- Its broad scope may be unnecessary for CPU-only profiling needs
- Support for the free download is community-based
Our verdict on Intel VTune Profiler
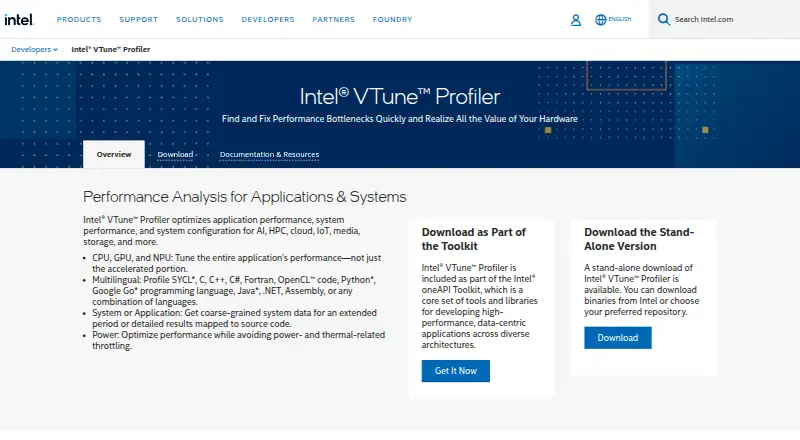
Intel VTune Profiler is a desktop and command-line performance analysis tool for developers working with serial and multithreaded applications. It helps identify CPU hotspots, hot code paths, memory-access and microarchitecture bottlenecks, threading issues, I/O constraints, and GPU or NPU offload problems. It supports languages including C, C++, C#, Fortran, Java, OpenCL, Python, Go, SYCL, .NET, and Assembly, making it suitable for teams profiling applications across varied technology stacks.
Its ecosystem coverage is a central strength. VTune works with OpenMP, Intel oneTBB, MPI, SYCL, and OpenCL, and integrates with Microsoft Visual Studio, Visual Studio Code, and Eclipse. Container and virtualization support includes Docker, Singularity, LXC, KVM, Hyper-V, and VMware. The desktop GUI, command-line interfaces, Flame Graph visualization, and AI Assistant support different analysis workflows, from interactive investigation to command-driven profiling. Windows and Linux host support provides a clear fit for those environments, while the desktop deployment model is less suited to teams seeking a hosted profiling service.
The free download is available as a standalone tool or through the Intel oneAPI Toolkit, with commercial and non-commercial use permitted. Community support is available, and the published offering does not require a paid VTune Profiler tier. This makes VTune a practical choice for developers who want wide profiling coverage without a software license cost. It is a better fit for applications spanning multiple performance domains than for teams that need only a narrowly focused CPU profiler. Choose it when broad systems and application analysis matters; consider a more specialized tool when a smaller scope or hosted workflow is the priority.
Questions about Intel VTune Profiler
Does Intel VTune Profiler have a free plan? Yes: the Free download plan is free.
What does Intel VTune Profiler run on? Windows and Linux. It runs as a desktop app.
What does Intel VTune Profiler integrate with? 14 integrations, including OpenMP, Intel oneTBB, MPI, SYCL and OpenCL.
Who is Intel VTune Profiler built for? Solo users, small businesses, mid-market companies and enterprises (our editorial estimate).
Your product? Our editors can test Intel VTune Profiler in depth and publish a review, labelled as paid · from $149/mo →
Intel VTune Profiler pricing
All 1 Intel VTune Profiler plans and prices →
Intel VTune Profiler fact sheet
| Free plan | Yes |
|---|---|
| Paid from | Free |
| Profiling modes | Both |
| Supported languages | C, C++, C#, Fortran, Java, OpenCL, Python, Go, SYCL, .NET, Assembly |
| CPU profiling | Yes |
| Memory profiling | Yes |
| Thread profiling | Yes |
| Deployment model | Desktop |
| Deployment | Desktop |
| Platforms | Windows, Linux |
| Support | Community, Docs |
| Built for | Solo, Small business, Mid-market, Enterprise (editorial estimate) |
| Integrations | 14 integrations: OpenMP, Intel oneTBB, MPI, SYCL, OpenCL, Microsoft Visual Studio … |
| Pricing | Free plan (source) |
| Website | intel.com |
| Facts checked | 20 Sep 2026 |
Intel VTune Profiler integrations
Intel VTune Profiler lists 14 integrations on its own site.
- OpenMP
- Intel oneTBB
- MPI
- SYCL
- OpenCL
- Microsoft Visual Studio
- Visual Studio Code
- Eclipse
- Docker
- Singularity
- LXC
- KVM
- Hyper-V
- VMware
Alternatives to Intel VTune Profiler
- AMD uProfA free AMD-focused profiler with broad CPU, system, threading, power, GPU, and tracing analysis.9.2
- PyroscopeA flexible profiler for teams that need continuous CPU and memory visibility at scale.9.1
- Google Cloud ProfilerA free cloud profiler for continuous CPU, memory, thread, and wall-time analysis.9.0


See all Intel VTune Profiler alternatives →
Intel VTune Profiler vs the competition
- Intel VTune Profiler vs AMD uProf
- Intel VTune Profiler vs Pyroscope
- Intel VTune Profiler vs Google Cloud Profiler
- Intel VTune Profiler vs JProfiler
- Intel VTune Profiler vs Valgrind
- Intel VTune Profiler vs Amazon CodeGuru Profiler


Compare Intel VTune Profiler with any tool side by side →
Also Ranked In
Intel VTune Profiler is ranked in 12 of our directories; the 6 strongest besides Profiling Software.
Used Intel VTune Profiler? Be the first to review it
The editor score above is our own research. What this page doesn't have yet is a reader's view — what you used Intel VTune Profiler for, what worked and what didn't. No stars are seeded and no review is paid for; an editor reads every one before it appears.
Write a reviewTwo minutes · verified accounts only · read by an editor before it appears
Featured on iTechGuides

Intel VTune Profiler is listed in our Profiling Software directory. Add the badge to your site — it links back to this page.
<a href="https://www.itechguides.com/products/intel-vtune-profiler/"><img src="https://www.itechguides.com/best/badge/intel-vtune-profiler.svg" alt="Featured on iTechGuides" width="230" height="46"></a>
Reviewed by iTechGuides Editors · Editorial team · Updated Nov 2026
Advertiser disclosure: iTechGuides is reader-supported. Vendors can pay for top positions in our rankings and for a place on other products' pages, and we may earn a commission when you click some links. Bought places stand at the number bought; this page and our disclosure say so. Paying vendors may get a fuller, more detailed review from our editors, and that review can change their score. How we rank.
Last updated · How we research and update