AMD uProf
AMD uProf: A free AMD-focused profiler with broad CPU, system, threading, power, GPU, and tracing analysis. Ranked #2 of 28 in Profiling Software by our editors (9.2/10); pricing: Free; best for free AMD and cross-compiler systems profiling.
At a glance
- Editor score9.2 / 10
- PricingFree
- Best forFree AMD and cross-compiler systems profiling
- Paid fromFree
- Profiling modesBoth
- Founded1969 · Santa Clara, California, United States
- Facts checked20 Sep 2026
Where it wins
- Covers CPU, threading, system, power, GPU, OS, OpenMP, and MPI profiling
- Supports AMD AOCC, Microsoft, Intel, GNU, and LLVM compilers
- Profiles C, C++, Fortran, Assembly, Java, Python, and .NET workloads
Where it doesn't
- GPU profiling and tracing are for AMD Instinct systems
- Desktop deployment limits it to local and remote profiling workflows
- It is proprietary rather than open source
Our verdict on AMD uProf
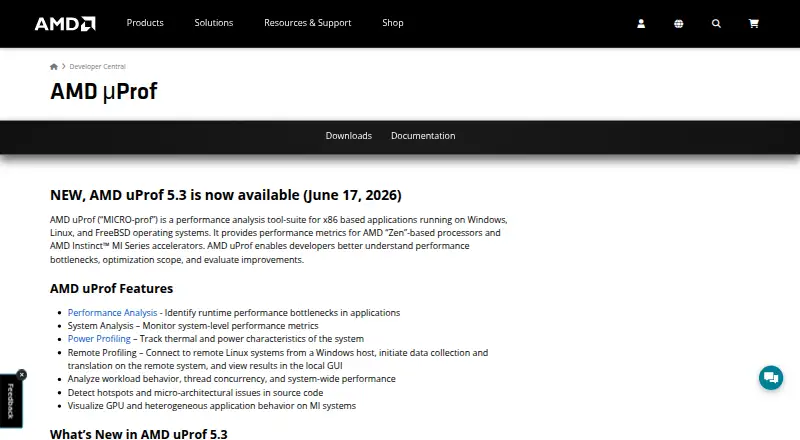
AMD uProf is a desktop performance-analysis suite for developers optimizing x86 applications on AMD platforms. It supports Windows, Linux, and FreeBSD downloads, with profiling capabilities for C, C++, Fortran, Assembly, Java, Python, and .NET. The tool is suited to teams investigating application hotspots, thread behavior, system performance, power characteristics, or parallel OpenMP and MPI workloads.
Its main strength is breadth. CPU profiling combines OS timers, performance-monitoring counters, and instruction-based sampling, while hotspot analysis identifies time-consuming functions and threading analysis provides thread-state timelines. System analysis covers metrics such as IPC and memory bandwidth, and live power profiling addresses thermal and power characteristics. OS, OpenMP, and MPI tracing extend the analysis beyond individual functions. GPU profiling and tracing are also available for AMD Instinct systems.
Compiler and workflow coverage make uProf a practical fit for mixed development environments. It supports AMD AOCC alongside Microsoft, Intel, GNU, and LLVM compilers, and remote profiling can connect a Windows host to Linux systems. The Profile Control API and Power Profiler API provide programmatic access for teams that need profiling within their own tooling. Choose AMD uProf when broad local analysis across CPU, threading, system, power, and parallel workloads matters, particularly on AMD platforms. It is less suitable for teams seeking an open-source profiler or GPU analysis beyond AMD Instinct systems.
Your product? Our editors can test AMD uProf in depth and publish a review, labelled as paid · from $149/mo →
AMD uProf pricing
AMD uProf fact sheet
| Free plan | Not verified |
|---|---|
| Paid from | Free |
| Profiling modes | Both |
| Supported languages | C, C++, Fortran, Assembly, Java, Python, .NET |
| CPU profiling | Yes |
| Memory profiling | Yes |
| Thread profiling | Yes |
| Deployment model | Desktop |
| Deployment | Desktop |
| Platforms | Windows, Linux |
| Support | Docs |
| Built for | Small business, Mid-market, Enterprise (editorial estimate) |
| Integrations | 7 integrations: OpenMP, MPI, AMD AOCC, Microsoft compilers, Intel compilers, GNU compilers … |
| Pricing | Free |
| Website | amd.com |
| Facts checked | 20 Sep 2026 |
AMD uProf integrations
AMD uProf lists 7 integrations on its own site.
- OpenMP
- MPI
- AMD AOCC
- Microsoft compilers
- Intel compilers
- GNU compilers
- LLVM compilers
Alternatives to AMD uProf
- Intel VTune ProfilerA free profiler covering CPU, memory, threading, GPU/NPU, I/O, MPI, and OpenMP.9.4
- PyroscopeA flexible profiler for teams that need continuous CPU and memory visibility at scale.9.1
- Google Cloud ProfilerA free cloud profiler for continuous CPU, memory, thread, and wall-time analysis.9.0



See all AMD uProf alternatives →
AMD uProf vs the competition
- AMD uProf vs Intel VTune Profiler
- AMD uProf vs Pyroscope
- AMD uProf vs Google Cloud Profiler
- AMD uProf vs JProfiler
- AMD uProf vs Valgrind
- AMD uProf vs Amazon CodeGuru Profiler


Compare AMD uProf with any tool side by side →
Used AMD uProf? Be the first to review it
The editor score above is our own research. What this page doesn't have yet is a reader's view — what you used AMD uProf for, what worked and what didn't. No stars are seeded and no review is paid for; an editor reads every one before it appears.
Write a reviewTwo minutes · verified accounts only · read by an editor before it appears
Featured on iTechGuides

AMD uProf is listed in our Profiling Software directory. Add the badge to your site — it links back to this page.
<a href="https://www.itechguides.com/products/amd-uprof/"><img src="https://www.itechguides.com/best/badge/amd-uprof.svg" alt="Featured on iTechGuides" width="230" height="46"></a>
Reviewed by iTechGuides Editors · Editorial team · Updated Oct 2026
Advertiser disclosure: iTechGuides is reader-supported. Vendors can pay for top positions in our rankings and for a place on other products' pages, and we may earn a commission when you click some links. Bought places stand at the number bought; this page and our disclosure say so. Paying vendors may get a fuller, more detailed review from our editors, and that review can change their score. How we rank.
Last updated · How we research and update