PerfView
PerfView: A free, open-source choice for detailed Windows and .NET diagnostics. Ranked #21 of 28 in Profiling Software by our editors (7.8/10); pricing: Free plan; best for free Windows and .NET diagnostics.
At a glance
- Editor score7.8 / 10
- PricingFree plan
- Best forFree Windows and .NET diagnostics
- Free planYes
- Paid fromFree
- Profiling modesSampling
- Facts checked20 Sep 2026
Where it wins
- Free and open source for desktop-based performance analysis
- Combines CPU, memory, heap, thread, ETW, and EventPipe analysis
- Supports .NET, C/C++, JScript, symbols, dumps, and trace comparison
Where it doesn't
- Windows desktop application limits native platform coverage
- Linux support is limited to analyzing some collected data
- Its wide diagnostic scope may require specialist performance knowledge
Our verdict on PerfView
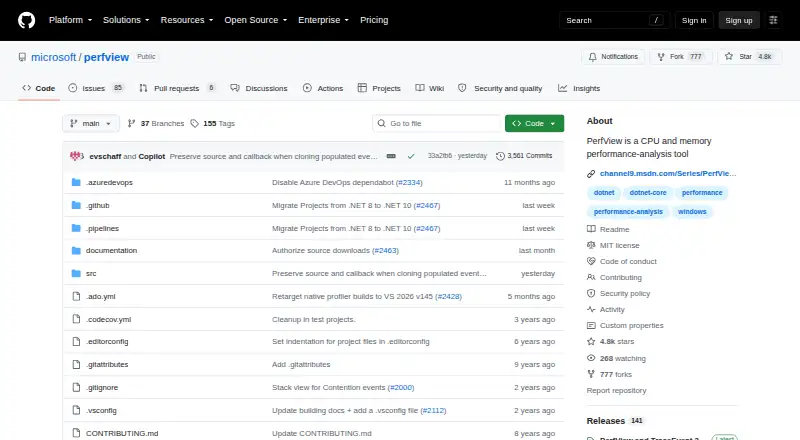
PerfView is a free, open-source Windows desktop application from Microsoft for investigating CPU and memory-related performance issues. It is aimed at developers and performance engineers working with .NET, native Windows applications, and related runtime or system traces. The tool supports sampling-based profiling across C/C++, .NET, and JScript, with CPU, memory, and thread profiling capabilities in a desktop deployment model.
Its main strength is the depth of its diagnostic coverage. PerfView can collect and parse Event Tracing for Windows data, process EventPipe and .NET traces, inspect managed allocations, and analyze CPU stacks. It also supports heap snapshot collection and comparison, trace and heap-dump diffing, symbol resolution for .NET, JScript, and native code, and real-time ETW event monitoring. That combination makes it suitable when an investigation needs to connect CPU activity, allocations, heap state, thread behavior, and runtime events in one tool.
The trade-off is platform focus. PerfView runs as a Windows application, while its Linux capability is limited to analyzing some data collected on Linux rather than providing a native Linux application. Teams working primarily with Windows, .NET, or native Windows traces should find its coverage aligned with their diagnostic needs. Teams seeking a cross-platform profiling application or a simpler, narrower workflow should choose a tool designed around those requirements instead.
Your product? Our editors can test PerfView in depth and publish a review, labelled as paid · from $149/mo →
PerfView pricing
PerfView fact sheet
| Free plan | Yes |
|---|---|
| Paid from | Free |
| Profiling modes | Sampling |
| Supported languages | C/C++, .NET, JScript |
| CPU profiling | Yes |
| Memory profiling | Yes |
| Thread profiling | Yes |
| Deployment model | Desktop |
| Deployment | Desktop |
| Platforms | Windows |
| Support | Community, Docs |
| Built for | Solo, Small business, Mid-market, Enterprise (editorial estimate) |
| Pricing | Free plan |
| Website | github.com |
| Facts checked | 20 Sep 2026 |
Alternatives to PerfView
- Intel VTune ProfilerA free profiler covering CPU, memory, threading, GPU/NPU, I/O, MPI, and OpenMP.9.4
- AMD uProfA free AMD-focused profiler with broad CPU, system, threading, power, GPU, and tracing analysis.9.2
- PyroscopeA flexible profiler for teams that need continuous CPU and memory visibility at scale.9.1


See all PerfView alternatives →
Used PerfView? Be the first to review it
The editor score above is our own research. What this page doesn't have yet is a reader's view — what you used PerfView for, what worked and what didn't. No stars are seeded and no review is paid for; an editor reads every one before it appears.
Write a reviewTwo minutes · verified accounts only · read by an editor before it appears
Featured on iTechGuides

PerfView is listed in our Profiling Software directory. Add the badge to your site — it links back to this page.
<a href="https://www.itechguides.com/products/perfview/"><img src="https://www.itechguides.com/best/badge/perfview.svg" alt="Featured on iTechGuides" width="230" height="46"></a>
Reviewed by iTechGuides Editors · Editorial team · Updated Oct 2026
Advertiser disclosure: iTechGuides is reader-supported. Vendors can pay for top positions in our rankings and for a place on other products' pages, and we may earn a commission when you click some links. Bought places stand at the number bought; this page and our disclosure say so. Paying vendors may get a fuller, more detailed review from our editors, and that review can change their score. How we rank.
Last updated · How we research and update