
Go pprof
Go pprof: A free, focused profiler for diagnosing performance and concurrency issues in Go. Ranked #12 of 28 in Profiling Software by our editors (7.9/10); pricing: Free plan; best for free built-in Go profiling.
At a glance
- Editor score7.9 / 10
- PricingFree plan
- Best forFree built-in Go profiling
- Free planYes
- Paid fromFree
- Profiling modesSampling
- Facts checked20 Sep 2026
Where it wins
- Free and open source with no separate hosted product
- Profiles CPU, memory, goroutines, threads, blocking and mutex contention
- Supports HTTP endpoints, custom profiles and multiple visualizations
Where it doesn't
- Supports Go programs rather than multiple programming languages
- Self-hosted deployment requires your own runtime and tooling
- Sampling profiles may not suit every profiling requirement
Our verdict on Go pprof
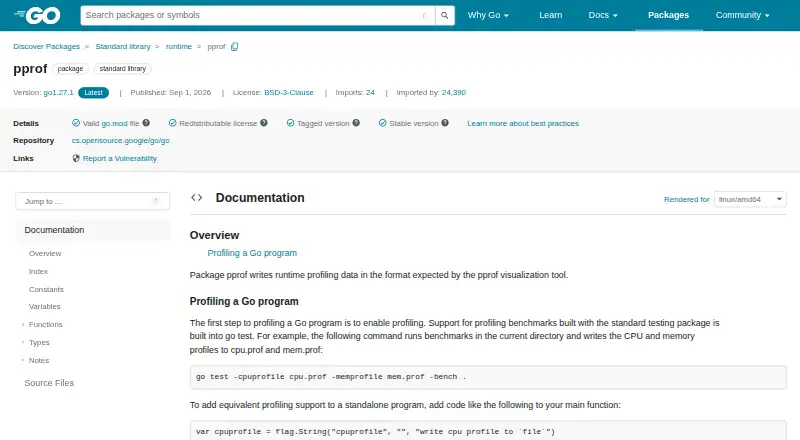
Go pprof is the Go standard library's runtime profiling functionality for developers investigating performance, memory, concurrency and synchronization problems. It can collect CPU, heap and allocation, goroutine, thread-creation, blocking and mutex profiles from Go programs. Teams can generate profiles during tests, embed profiling in standalone applications or expose runtime profiles through HTTP handlers. The tool is aimed at Go-focused local applications and production services rather than teams seeking a hosted, multi-language profiling platform.
Its strongest advantage is breadth within the Go runtime. CPU profiling covers active processor usage, while heap and allocation profiling helps examine memory behavior. Goroutine stack traces, thread creation, blocking and mutex contention extend the view into concurrency and synchronization. Custom profile creation adds flexibility for application-specific measurements. The published functionality also supports text, graph and callgrind visualization through the go tool pprof command-line tool, giving developers several ways to inspect collected profiles.
Go pprof is free and open source, with a sampling profiling mode and a self-hosted deployment model. That makes it a practical choice for organizations that want built-in Go profiling without adopting a separate hosted product. It is less suitable for teams that need one profiler across several programming languages, a managed platform, or workflows outside Go-oriented applications. Choose it when your services are written in Go and you want runtime-level visibility into CPU, memory, goroutines, threads and locks; consider an alternative when broader language coverage or hosted operations are central requirements.
Your product? Our editors can test Go pprof in depth and publish a review, labelled as paid · from $149/mo →
Go pprof pricing
Go pprof fact sheet
| Free plan | Yes |
|---|---|
| Paid from | Free |
| Profiling modes | Sampling |
| Supported languages | Go |
| CPU profiling | Yes |
| Memory profiling | Yes |
| Thread profiling | Yes |
| Deployment model | Self-hosted |
| Deployment | Self-hosted |
| Support | Docs, Community |
| Built for | Solo, Small business, Mid-market, Enterprise (editorial estimate) |
| Pricing | Free plan |
| Website | pkg.go.dev |
| Facts checked | 20 Sep 2026 |
Alternatives to Go pprof
- Intel VTune ProfilerA free profiler covering CPU, memory, threading, GPU/NPU, I/O, MPI, and OpenMP.9.4
- AMD uProfA free AMD-focused profiler with broad CPU, system, threading, power, GPU, and tracing analysis.9.2
- PyroscopeA flexible profiler for teams that need continuous CPU and memory visibility at scale.9.1


See all Go pprof alternatives →
Used Go pprof? Be the first to review it
The editor score above is our own research. What this page doesn't have yet is a reader's view — what you used Go pprof for, what worked and what didn't. No stars are seeded and no review is paid for; an editor reads every one before it appears.
Write a reviewTwo minutes · verified accounts only · read by an editor before it appears
Featured on iTechGuides

Go pprof is listed in our Profiling Software directory. Add the badge to your site — it links back to this page.
<a href="https://www.itechguides.com/products/go-pprof/"><img src="https://www.itechguides.com/best/badge/go-pprof.svg" alt="Featured on iTechGuides" width="230" height="46"></a>
Reviewed by iTechGuides Editors · Editorial team · Updated Oct 2026
Advertiser disclosure: iTechGuides is reader-supported. Vendors can pay for top positions in our rankings and for a place on other products' pages, and we may earn a commission when you click some links. Bought places stand at the number bought; this page and our disclosure say so. Paying vendors may get a fuller, more detailed review from our editors, and that review can change their score. How we rank.
Last updated · How we research and update