GNU gprof
GNU gprof: A free, focused choice for function timing and call-graph analysis in C and C++. Ranked #15 of 28 in Profiling Software by our editors (7.9/10); pricing: Open source; best for basic free C and C++ call-graph profiling.
At a glance
- Editor score7.9 / 10
- PricingOpen source
- Best forBasic free C and C++ call-graph profiling
- Paid fromFree
- Profiling modesBoth
- Facts checked20 Sep 2026
Where it wins
- Free and open source under the GNU Binutils project
- Combines flat profiles, call graphs, and annotated source output
- Supports C++ symbol demangling and merged profile data files
Where it doesn't
- Focused on C and C++ rather than broader language coverage
- Does not provide verified memory or thread profiling
- Offers limited platform and integration breadth
Our verdict on GNU gprof
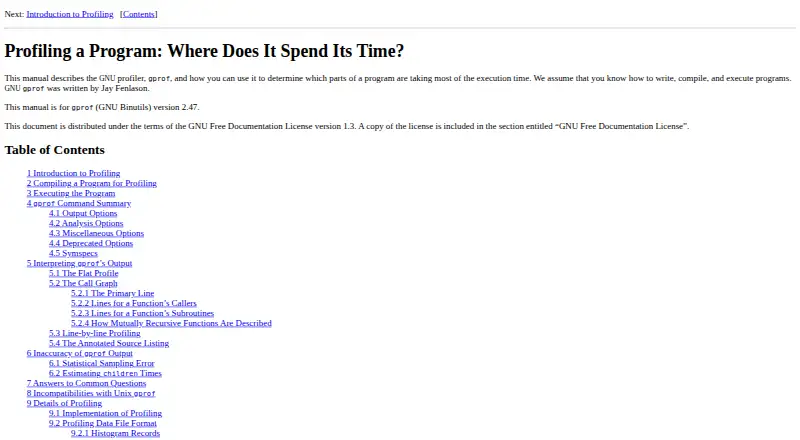
GNU gprof is a command-line profiler in the GNU Binutils project for developers analyzing compiled C and C++ programs. It requires programs to be compiled and linked with profiling enabled, then run to generate profile data for analysis. The tool is suited to users who want function-level execution timing, caller and callee relationships, source annotations, and execution counts without adopting a broader profiling platform.
Its main strength is the breadth of analysis within a focused command-line workflow. GNU gprof provides flat profiling by function, call-graph analysis, annotated source listings, line-by-line profiling, and basic-block execution counts. It also supports static call-graph heuristics, C++ symbol demangling, and merging multiple profile data files. These capabilities make it useful for examining where execution time is spent and how calls move through a program. As free and open-source software, it is accessible for projects that need core CPU profiling without a paid tier.
The tradeoff is scope. GNU gprof is centered on compiled C and C++ programs and does not offer verified memory or thread profiling, while its platform and integration breadth is limited. Developers who need a narrow, text-oriented view of CPU behavior should find its feature set appropriate; teams seeking wider runtime coverage, broader ecosystem integration, or memory and thread analysis should choose a profiler designed for those needs instead. The GNU Binutils project also identifies gprofng as a newer profiler in the same project.
Your product? Our editors can test GNU gprof in depth and publish a review, labelled as paid · from $149/mo →
GNU gprof pricing
GNU gprof fact sheet
| Free plan | Not verified |
|---|---|
| Paid from | Free |
| Profiling modes | Both |
| Supported languages | C, C++ |
| CPU profiling | Yes |
| Memory profiling | Not verified |
| Thread profiling | Not verified |
| Deployment model | Desktop |
| Deployment | Desktop |
| Support | Docs |
| Pricing | Open source |
| Website | sourceware.org |
| Facts checked | 20 Sep 2026 |
Alternatives to GNU gprof
- Intel VTune ProfilerA free profiler covering CPU, memory, threading, GPU/NPU, I/O, MPI, and OpenMP.9.4
- AMD uProfA free AMD-focused profiler with broad CPU, system, threading, power, GPU, and tracing analysis.9.2
- PyroscopeA flexible profiler for teams that need continuous CPU and memory visibility at scale.9.1


See all GNU gprof alternatives →
Used GNU gprof? Be the first to review it
The editor score above is our own research. What this page doesn't have yet is a reader's view — what you used GNU gprof for, what worked and what didn't. No stars are seeded and no review is paid for; an editor reads every one before it appears.
Write a reviewTwo minutes · verified accounts only · read by an editor before it appears
Featured on iTechGuides

GNU gprof is listed in our Profiling Software directory. Add the badge to your site — it links back to this page.
<a href="https://www.itechguides.com/products/gnu-gprof/"><img src="https://www.itechguides.com/best/badge/gnu-gprof.svg" alt="Featured on iTechGuides" width="230" height="46"></a>
Reviewed by iTechGuides Editors · Editorial team · Updated Oct 2026
Advertiser disclosure: iTechGuides is reader-supported. Vendors can pay for top positions in our rankings and for a place on other products' pages, and we may earn a commission when you click some links. Bought places stand at the number bought; this page and our disclosure say so. Paying vendors may get a fuller, more detailed review from our editors, and that review can change their score. How we rank.
Last updated · How we research and update