eurostat-map.js
eurostat-map.js: A focused open-source choice for developers mapping statistical data on the web. Ranked #35 of 39 in Interactive Map Software by our editors (5.7/10); pricing: Free plan; best for developers making statistical thematic maps.
At a glance
- Editor score5.7 / 10
- PricingFree plan
- Best forDevelopers making statistical thematic maps
- Free planYes
- Paid fromFree
- Facts checked23 Sep 2026
Where it wins
- Open-source library with a free plan
- Supports interactive maps for websites and applications
- Focused on thematic mapping of statistical data
Where it doesn't
- Designed for web deployment only
- Narrow scope centered on statistical thematic maps
- No AI features
Our verdict on eurostat-map.js
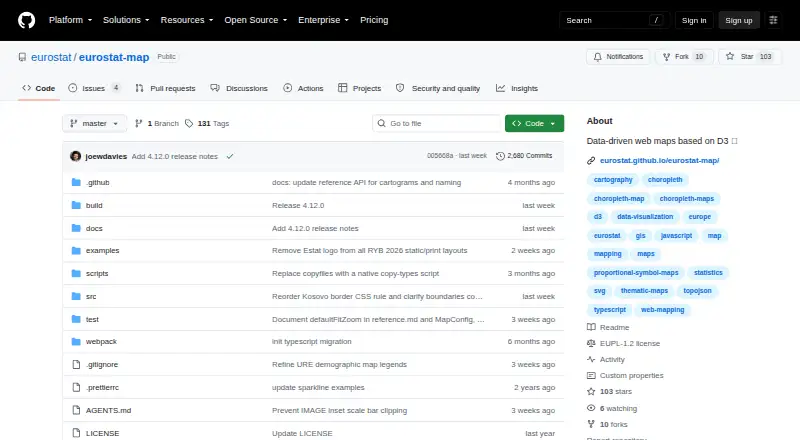
eurostat-map.js is an open-source JavaScript library from Eurostat for developers who need interactive maps in websites or applications. Its main use case is thematic mapping of statistical data, making it suited to teams building data visualizations rather than general-purpose geographic information systems. The library is distributed through a public source-code repository and can fit solo developers through enterprise teams working on web projects.
The clearest strength is its focused mapping workflow. JavaScript is the core delivery format, while interactive maps and statistical thematic maps define the feature scope. That focus can help developers whose projects depend on presenting statistical patterns visually on the web. The open-source model also provides a free plan and avoids a subscription-oriented product structure. For organizations already building web applications, the browser-based orientation keeps the product aligned with that deployment context.
The trade-off is breadth. eurostat-map.js concentrates on interactive statistical mapping instead of presenting a wider set of product capabilities, and it does not include AI features. Teams looking for a broader mapping platform, additional feature categories, or capabilities beyond web deployment should evaluate alternatives. Choose eurostat-map.js when a development team wants an open-source JavaScript foundation for thematic statistical maps; choose another product when the requirement extends beyond that specialized visualization brief.
Your product? Our editors can test eurostat-map.js in depth and publish a review, labelled as paid · from $149/mo →
eurostat-map.js pricing
eurostat-map.js fact sheet
| Free plan | Yes |
|---|---|
| Paid from | Free |
| Data refresh | Not verified |
| Custom branding | Not verified |
| Access control | Not verified |
| Map layers | Not verified |
| Viewer limit | Not verified |
| Embed options | Not verified |
| API access | Not verified |
| Deployment | Cloud |
| Platforms | Web |
| Built for | Solo, Small business, Mid-market, Enterprise (editorial estimate) |
| Pricing | Free plan |
| Website | github.com |
| Facts checked | 23 Sep 2026 |
Alternatives to eurostat-map.js
- Mapbox StudioA capable Mapbox styling workspace for teams building custom map experiences.9.4
- FeltA broad mapping workspace for teams that need collaboration, analysis, and live data.9.2
- CARTOAdvanced spatial analytics, mapping, optimization, and developer tools for enterprise teams.9.1



See all eurostat-map.js alternatives →
Used eurostat-map.js? Be the first to review it
The editor score above is our own research. What this page doesn't have yet is a reader's view — what you used eurostat-map.js for, what worked and what didn't. No stars are seeded and no review is paid for; an editor reads every one before it appears.
Write a reviewTwo minutes · verified accounts only · read by an editor before it appears
Featured on iTechGuides

eurostat-map.js is listed in our Interactive Map Software directory. Add the badge to your site — it links back to this page.
<a href="https://www.itechguides.com/products/eurostat-map-js/"><img src="https://www.itechguides.com/best/badge/eurostat-map-js.svg" alt="Featured on iTechGuides" width="230" height="46"></a>
Reviewed by iTechGuides Editors · Editorial team · Updated Oct 2026
Advertiser disclosure: iTechGuides is reader-supported. Vendors can pay for top positions in our rankings and for a place on other products' pages, and we may earn a commission when you click some links. Bought places stand at the number bought; this page and our disclosure say so. Paying vendors may get a fuller, more detailed review from our editors, and that review can change their score. How we rank.
Last updated · How we research and update