async-profiler
async-profiler: A deep, self-hosted profiler for Java and native workloads, with narrower platform coverage. Ranked #10 of 28 in Profiling Software by our editors (8.3/10); pricing: Free plan; best for free, deep Java and native profiling.
At a glance
- Editor score8.3 / 10
- PricingFree plan
- Best forFree, deep Java and native profiling
- Free planYes
- Paid fromFree
- Profiling modesBoth
- Facts checked20 Sep 2026
Where it wins
- Profiles CPU, heap, native memory, locks, wall time and counters
- Outputs Flame Graphs and JFR, with Java and C APIs
- Open-source, self-hosted tooling for Java, C and C++
Where it doesn't
- Primarily targets Java applications on HotSpot-based JVMs
- Officially maintained builds focus on Linux and macOS
- Requires local binaries, libraries or agent integration
Our verdict on async-profiler
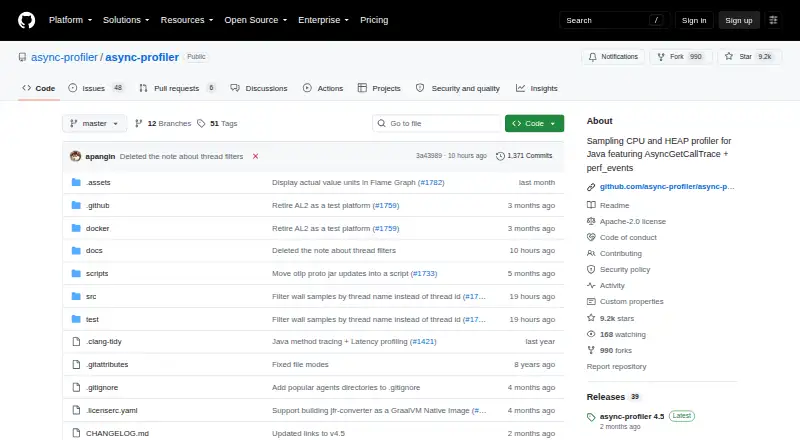
async-profiler is an open-source, self-hosted profiling tool primarily for Java applications running on HotSpot-based JVMs. It also supports native application profiling and integration with C and C++ through a native API. The project is aimed at developers and performance engineers who need detailed visibility into CPU activity, memory allocation, locks, wall-clock behavior and performance counters without adopting a hosted profiling service.
Its strongest advantage is the breadth of profiling modes in a single tool. CPU profiling can include Java, native, JVM and kernel stack frames, while separate modes cover Java heap allocations, native memory allocations and leaks, Java monitors, native pthread locks, and running, sleeping or blocked threads. Java method instrumentation and tracing add more detail, and hardware and software performance counters extend analysis beyond sampled execution. Flame Graph and JFR output provide established formats for examining results, while command-line tools, agent integration, Java APIs and C APIs support different operating models.
The published project details show a free open-source distribution delivered as local binaries and libraries rather than a hosted service. Officially maintained builds are listed for Linux and macOS, with other ports documented, so teams should align deployment plans with their target environments. The supported language scope is Java, C and C++, and the deployment model is self-hosted. Choose async-profiler when deep Java and native profiling, programmatic control and multiple output formats matter. Consider another profiling product if your priority is broader platform or language coverage, or a hosted service instead of local tooling.
Your product? Our editors can test async-profiler in depth and publish a review, labelled as paid · from $149/mo →
async-profiler pricing
async-profiler fact sheet
| Free plan | Yes |
|---|---|
| Paid from | Free |
| Profiling modes | Both |
| Supported languages | Java, C, C++ |
| CPU profiling | Yes |
| Memory profiling | Yes |
| Thread profiling | Yes |
| Deployment model | Self-hosted |
| Deployment | Self-hosted, Desktop |
| Platforms | Linux, macOS |
| Support | Community, Docs |
| Built for | Solo, Small business, Mid-market, Enterprise (editorial estimate) |
| Pricing | Free plan |
| Website | github.com |
| Facts checked | 20 Sep 2026 |
Alternatives to async-profiler
- Intel VTune ProfilerA free profiler covering CPU, memory, threading, GPU/NPU, I/O, MPI, and OpenMP.9.4
- AMD uProfA free AMD-focused profiler with broad CPU, system, threading, power, GPU, and tracing analysis.9.2
- PyroscopeA flexible profiler for teams that need continuous CPU and memory visibility at scale.9.1


See all async-profiler alternatives →
Used async-profiler? Be the first to review it
The editor score above is our own research. What this page doesn't have yet is a reader's view — what you used async-profiler for, what worked and what didn't. No stars are seeded and no review is paid for; an editor reads every one before it appears.
Write a reviewTwo minutes · verified accounts only · read by an editor before it appears
Featured on iTechGuides

async-profiler is listed in our Profiling Software directory. Add the badge to your site — it links back to this page.
<a href="https://www.itechguides.com/products/async-profiler/"><img src="https://www.itechguides.com/best/badge/async-profiler.svg" alt="Featured on iTechGuides" width="230" height="46"></a>
Reviewed by iTechGuides Editors · Editorial team · Updated Oct 2026
Advertiser disclosure: iTechGuides is reader-supported. Vendors can pay for top positions in our rankings and for a place on other products' pages, and we may earn a commission when you click some links. Bought places stand at the number bought; this page and our disclosure say so. Paying vendors may get a fuller, more detailed review from our editors, and that review can change their score. How we rank.
Last updated · How we research and update