
iTechGuides is reader-supported. When you buy through links on our site, we may earn an affiliate commission. As an Amazon Associate I earn from qualifying purchases. Learn more
Windows has no single screen that reveals every hardware detail. For the most complete practical view, start with the built-in combination of msinfo32, Task Manager, Device Manager, and dxdiag. Add HWiNFO when you need detailed sensors and live monitoring, CPU-Z for RAM and motherboard information, GPU-Z for graphics-card details, and CrystalDiskInfo for drive health.
This guide is Windows-11-first and covers identification, configuration, live activity, driver status, sensor readings, and storage telemetry. Those are different from functional testing: a tool can identify a component without proving that it is stable, undamaged, or safe from future failure.
Which Windows hardware-information tool should you use?
Choose the tool according to the question you are trying to answer. No utility can reliably identify every physical property of a power supply, detect every damaged motherboard trace, or guarantee that an SSD will not fail.
Do these 3 things before closing this tab:
1Repair Windows errors before they cause bigger problems2Fix the driver behind crashes, sound loss and screen glitches3Clear out junk files and repair common Windows errors| What you need to know | Best starting point | Why |
|---|---|---|
| Basic PC specifications | Settings > System > About | Fast, built in, and easy to read |
| Live CPU, memory, disk, network, or GPU activity | Task Manager | Shows current utilization without installing software |
| A broad support report | msinfo32 |
Includes hardware, drivers, components, and software-environment details |
| Unknown devices or driver errors | Device Manager | Shows device status codes, drivers, and hardware IDs |
| Graphics, audio, and DirectX support information | dxdiag |
Produces a support-ready display, sound, and DirectX report |
| Repeatable inventory of several PCs | PowerShell CIM queries | Scriptable and exportable to text or CSV |
| Temperatures, clocks, fans, voltages, and throttling | HWiNFO | Broad sensor coverage and logging |
| CPU, motherboard, and RAM-module details | CPU-Z | Especially useful for SPD and per-slot memory information |
| Exact graphics-card identity and bus details | GPU-Z | Focused GPU architecture, VRAM, BIOS, and PCIe information |
| HDD, SSD, or NVMe health telemetry | CrystalDiskInfo | Reads SMART and vendor-reported storage data when available |
Before you start
The paths below use current Windows 11 labels. Most of the commands and utilities also work on Windows 10, but Microsoft ended Windows 10 support on October 14, 2025; see Microsoft’s Windows device-information guidance for the current support context.
Popular on Amazon
Hardware information comes from several places: firmware and SMBIOS tables, Windows Management Instrumentation, device drivers, PCI and USB descriptors, storage controllers, and hardware sensors. If firmware reports a generic model, a manufacturer supplies an incorrect value, a USB enclosure hides SMART data, or you are viewing a virtual machine, different tools may disagree or leave fields blank. That is normal enough that results should be cross-checked against the tool best suited to the specific question.
Also distinguish five different things:
- Identification: what component is installed?
- Configuration: how is it configured, such as memory speed or PCIe link state?
- Current state: what is it doing now, such as CPU load or GPU utilization?
- Health telemetry: what does the device firmware report about temperature, wear, or errors?
- Functional and physical condition: does it remain stable under load, and are the board, cables, fans, connectors, and cooling hardware intact?
The ten tools below cover the first four categories well. The fifth still requires appropriate testing and, sometimes, physical inspection.
1. Settings: System > About and Storage
Best for: a quick, no-download check of the computer model, processor, installed RAM, Windows edition, and system type.
What’s actually slowing this PC down?
Pick the symptom - the matching free tool is one click away.
Open it
- Right-click Start.
- Select Settings.
- Open System > About.
Microsoft identifies the About page as the place to find the device name and model, Windows edition and version, processor, installed RAM, and whether Windows is 32-bit or 64-bit. For storage capacity and free space, open Settings > System > Storage. If the PC has more than one physical drive, use Advanced storage settings > Storage used on other drives.
It can show:
- Device name and OEM model
- Processor name
- Installed RAM
- System type
- Windows edition and version
- Available storage space
It generally cannot show: the exact motherboard model, RAM slot population and timings, detailed GPU architecture, SSD firmware and SMART attributes, CPU or GPU temperatures, fan speeds, motherboard voltages, or detailed driver errors.
Settings is therefore the fastest starting point, not a complete hardware inventory. A laptop’s About page may identify the manufacturer model while hiding the exact RAM modules, wireless card, panel, storage device, or motherboard revision.
2. Task Manager: Performance tab
Best for: live resource usage and basic hardware information while a problem is occurring.
Quick wins for a faster PC:
Scan for outdated or missing drivers - takes under a minuteDriver Scan →Repair Windows errors before they cause bigger problemsFix Now →Fix the driver behind crashes, sound loss and screen glitchesFind Drivers →Open it
Press Ctrl+Shift+Esc, or right-click Start and select Task Manager. Open the Performance tab.
Microsoft describes Task Manager as a monitor for CPU load, memory usage, disk activity, network usage, and GPU performance. Its main panels include:
- CPU: processor name, utilization, current speed, base speed, sockets, cores, logical processors, virtualization status, and cache information where supported.
- Memory: total and available RAM, usage, speed, form factor, and slots used when Windows can obtain those values.
- Disk: drive label, capacity, active time, read/write activity, and whether Windows identifies the device as an SSD or HDD.
- Wi-Fi or Ethernet: link activity and current network throughput.
- GPU: adapter name, utilization, dedicated and shared memory, driver version, and temperature on supported hardware and drivers.
Task Manager is particularly useful for correlating symptoms with activity. If the computer feels slow, sort the Processes tab by CPU, memory, disk, or GPU. During a game, watch GPU utilization, dedicated memory, temperature, and the relevant engine activity. For a disk slowdown, compare active time with the actual read/write rate and application response rather than looking only at free capacity.
Do not interpret the CPU speed as a fixed specification. It changes with workload, power management, thermal conditions, and boost behavior. GPU temperature is not available for every adapter, driver, remote session, or virtual machine. Task Manager also does not replace a sensor utility for CPU temperatures, motherboard voltages, fan curves, detailed throttling reasons, or SMART data.
Microsoft’s Task Manager support information describes its monitoring capabilities; labels and fields can vary between Windows builds and hardware.
3. System Information: msinfo32
Best for: the broadest built-in graphical inventory and a formal report for technical support, documentation, or a used-PC purchase.
Also popular on Amazon

- 【1】*** MUST see the 3rd pictures in listing that highlights the correct PCI slots to work ***. Using this kit wrongly on motherboard other PCIe port is not the reason of "Doesn't Work". Please make sure the motherboard has PCI slot before placing the order. The Large Desktop PC motherboard diagnostic card is NOT a PCIe card but a Standard PCI card. If the PC has PCIe express slots only, please see my other listing with the "V8 PCIe Diagnostic Kit" instead. ***DO NOT push the Wrong pins with excess force to avoid issue. MUST MAKE SURE PSU 4 / 6 / 8 pin power connector pins match and fit to the tester exact same 4, 6, 8 pins CORRECTLY although the PSU tester is fault tolerant and preventive.
- 【2】This starter kit comes with 1 large PCI test board and 1 small laptop test board for the old desktop PCs and old laptops diagnosis respectively. The large test board comes with【BIOS SPEAKER】to get the desktop PC motherboard Bios beep codes. The 【motherboard power switch cable】is nice to quick check the sticky or damaged PC motherboard power switch button and cable causing no power ON issue. The【the Anti Static Wrist Strap】is a plus to help discharge static during the PC repairs. The 【ATX PSU tester】in this kit is either Blue or Black Color with EXACT same features to quick test the 20/24 pins PC ATX PSUs.
- 【3】Nice starter kit for old computers no Power On / Auto Power OFF / no POST / no Display / no Boot ...etc. diagnosis. No need to swap Known Good Parts in the computer repairs. Save time and money!! All parts are packed well and stored neatly in a nice 【Portable Carrying Storage Case】. A overall great starter kit to add to our tool boxes! Great for computer class learning and old PCs quick troubleshooting needs as well.
- 【4】Please see the listing for the instruction PDFs. *****【On the listing page】, scroll down to after the "Product Information" table the "Product guides and documents" section, BOTH the pictorial "User Guide (PDF)" and the "User Manual (PDF)" are needed. *****. ***** Besides, please DO NOT discard the ITEM PACKING Included Paper Manual Note Printout since that also contains the complete Instruction folder info!!! *****
- 【5】Online Easy Guide and Pictorial Manuals to guide step by step with complete list of codes description. Downloadable manuals to stay updated. Welcome to conact if any question or need helps. Quality Genuine Computer Hardware Diagnostic Test Starter Kit with Free Lifetime Customer Service Supports from 29 years professional computer hardware work experienced seller.
Open it
- Press Windows+R.
- Type
msinfo32. - Press Enter.
For more complete driver and service information, open it with administrator rights. Microsoft describes System Information as a detailed view of hardware, system components, drivers, services, running processes, and the software environment.
Important categories
- System Summary: OEM, model, processor, BIOS or UEFI details, installed RAM, Windows version, and system type.
- Components > Display: graphics adapter information.
- Components > Storage > Disks: physical storage devices.
- Components > Storage > Drives: logical volumes such as
C:andD:. - Components > Problem Devices: hardware that Windows reports as problematic.
- Software Environment > System Drivers: installed or loaded driver information.
- Hardware Resources: IRQs, conflicts, DMA, and assigned resources where applicable.
The distinction between disks and drives matters. A physical disk may contain several logical drives, and a logical drive is not itself a separate physical device.
Export a report
In the interface, select a category or System Summary, then choose File > Export and save the text file. You can also use these commands:
msinfo32 /report "%USERPROFILE%Desktophardware-report.txt"msinfo32 /nfo "%USERPROFILE%Desktophardware-report.nfo"To see available category identifiers:
msinfo32 /showcategoriesTo create a focused system-summary file:
msinfo32 /nfo "%USERPROFILE%Desktopsystem-summary.nfo" /categories +systemsummaryMicrosoft documents the /report, /nfo, /computer, /showcategories, /category, and /categories switches in its msinfo32 command reference.
Important limitation: Microsoft says that msinfo32 can run in Safe Mode but cannot provide normal hardware information there; output is mainly limited to system components and software-environment information. If the report is incomplete, restart normally, run it as administrator, update chipset and device drivers, and cross-check with HWiNFO, CPU-Z, or PowerShell.
4. Device Manager
Best for: confirming that Windows detects a device, checking driver status, and identifying unknown hardware.
Open it and inspect a device
- Search for Device Manager from Start.
- Expand categories such as Display adapters, Network adapters, Disk drives, Processors, Sound, video and game controllers, Universal Serial Bus controllers, and System devices.
- Double-click a device and inspect its properties.
The key tabs are:
- General: device status and error code.
- Driver: provider, date, version, and update or rollback controls.
- Details: hardware IDs, compatible IDs, device instance path, service, and other properties.
- Events: installation and operational events.
- Resources: assigned resources where applicable.
Identify an unknown device
- Find the device with a warning icon or Unknown device label.
- Right-click it and select Properties.
- Open Details.
- Choose Hardware Ids from the property list.
- Copy an identifier beginning with values such as
PCIVEN_,USBVID_,HDAUDIO, orACPI.
Hardware IDs let Windows match a device to a driver package. Search the vendor and device identifier, or use the computer or motherboard manufacturer’s support page. Do not make a random driver-download site your first choice.
To display disconnected or non-present entries, open Device Manager and choose View > Show hidden devices. A gray device is not automatically evidence of a current failure: it may represent hardware that was physically removed but whose registry entry remains.
Common status codes
| Code | Meaning | How to interpret it |
|---|---|---|
| 10 | Device cannot start | Could be a driver, firmware, resource, or hardware problem |
| 28 | Driver is not installed | Install the correct driver from the OEM or component manufacturer |
| 43 | Windows stopped the device because it reported problems | May involve the driver, firmware, or the hardware itself; reinstalling the driver is not a guaranteed fix |
| 45 | Device is no longer connected | Often expected for removed or disconnected hardware |
| 52 | Windows cannot verify the driver’s digital signature | Use a correctly signed driver from a trusted source |
Device Manager narrows the problem but usually does not identify its root cause by itself. Microsoft’s references for hardware IDs, hidden devices, and Device Manager error codes explain these behaviors in more detail.
When Device Manager shows a missing, outdated, or incompatible hardware driver, Outbyte Driver Updater is an optional way to check for updates before you confirm the package with the OEM or component manufacturer.
The Tool Desk
Outbyte Driver Updater FREEFix the driver behind crashes, sound loss and screen glitchesFind Drivers →Outbyte PC Repair FREEClear out junk files and repair common Windows errorsFree Scan →5. DirectX Diagnostic Tool: dxdiag
Best for: graphics, audio, DirectX compatibility, driver information, and a support-ready report for games.
Open it
- Press Windows+R.
- Type
dxdiag. - Press Enter.
- If Windows asks whether it should verify digitally signed drivers, choose the appropriate option and continue.
Review these tabs:
- System: computer model, processor, RAM, BIOS or UEFI, Windows version, and DirectX version.
- Display or Render: GPU name, manufacturer, display memory, driver model, feature levels, and driver details. The exact tabs depend on the graphics configuration.
- Sound: audio device, driver, and DirectSound information.
- Input: connected input devices and related drivers.
Click Save All Information to create a text report. A DxDiag file is often more useful to game support than a screenshot because it combines system, display, sound, driver, and DirectX data.
Microsoft recommends dxdiag for checking the installed DirectX version. It is not a complete motherboard or sensor viewer, and it does not prove that a GPU is stable under load. Multiple GPUs, hybrid laptop graphics, remote desktop, and virtual machines can also produce confusing display entries. Use Microsoft’s DirectX guidance and the saved report when troubleshooting a particular game.
6. PowerShell: Get-ComputerInfo and CIM
Best for: repeatable, scriptable, exportable inventory, especially across multiple computers.
Free tools Windows power users keep installed
One-click scans. No signup required.
Also popular on Amazon

- 【Diagnose Check Engine Light in Seconds – No Mechanic Needed】The FOXWELL NT301 OBD2 scanner instantly reads & clears engine fault codes (DTCs) with one click. Simply plug into the 16-pin DLC port, turn ignition on, and get accurate results within seconds—No prior car knowledge required. Save hundreds on dealership fees by knowing exactly what’s wrong before you visit a shop. The #1 choice car scanner for DIYers and car owners who want to take control of their vehicle’s health
- 【Clear & Reset CEL with Confidence】Unlike cheap code readers that just erase codes temporarily, NT301 works like all professional vehicle code readers: It clears the check engine light only after you’ve fixed the underlying issue. If the problem isn’t fully repaired, the fault code will reappear. So you’ll never get a false pass. Use the foxwell scanner to verify your repair work and drive with peace of mind
- 【Sm-og Check Helper – Know Your Pass/Fail Status Before the Test】With dedicated one-click I/M readiness hotkeys and a simple Red-Yellow-Green LED indicator, you’ll instantly know if your vehicle is ready for annual testing. Built-in speaker provides clear audio feedback. No guesswork—just confidence before you head to the test center. One less thing to worry about when inspection day comes
- 【Advanced OBDII Modes – O- 2 Sensor & EVAP Testing】NT301 go beyond basic code reading with enhanced OBD2 modes. Run an EVAP system check to assess fuel tank condition, and use the O- 2 sensor test to optimize air-fuel ratio, boosting fuel economy, cutting em- issions, and saving you money at the pump. The code reader for cars and trucks is like having a mini em-issions lab in your glove box
- 【Live Data Graphing – Spot Engine Issues in Real Time】View and log live sensor data in easy-to-read graphs with this OBD2 scanner diagnostic tool. Monitor ox- ygen sensors, fuel trims, coolant temperature, RPM, and more to spot suspicious values instantly. This obd scanner gives you professional-grade insight without the pro price tag—a feature you won’t find on basic $20 car code readers
Get-ComputerInfo returns a consolidated object containing Windows and system properties. Run PowerShell from Start and use:
Get-ComputerInfoTo show version-related properties only:
Get-ComputerInfo -Property '*version'To save the full report:
Get-ComputerInfo | Out-File ($env:USERPROFILE + 'Desktopcomputer-info.txt')For more targeted hardware data, use CIM classes:
Get-CimInstance Win32_ComputerSystem | Select-Object Manufacturer, Model, SystemType, TotalPhysicalMemoryGet-CimInstance Win32_Processor | Select-Object Name, Manufacturer, NumberOfCores, NumberOfLogicalProcessors, MaxClockSpeedGet-CimInstance Win32_BIOS | Select-Object Manufacturer, SMBIOSBIOSVersion, ReleaseDate, SerialNumberGet-CimInstance Win32_PhysicalMemory | Select-Object Manufacturer, PartNumber, Capacity, Speed, DeviceLocatorGet-CimInstance Win32_VideoController | Select-Object Name, DriverVersion, VideoModeDescription, CurrentHorizontalResolution, CurrentVerticalResolutionGet-CimInstance Win32_DiskDrive | Select-Object Model, InterfaceType, MediaType, SerialNumber, SizeFor example, export memory-module data to CSV:
Get-CimInstance Win32_PhysicalMemory | Select-Object Manufacturer, PartNumber, Capacity, Speed, DeviceLocator | Export-Csv ($env:USERPROFILE + 'Desktopmemory.csv') -NoTypeInformationGet-CimInstance can query the local computer and, with suitable permissions and configuration, a remote computer. Remote inventory requires network access, permissions, and appropriate WMI or remoting configuration; it is not a way to inspect any computer automatically.
For a high-level storage status, try:
Get-PhysicalDisk | Select-Object FriendlyName, MediaType, Size, HealthStatus, OperationalStatusPowerShell is excellent for fleet inventory and comparison, but returned values are not always authoritative. Manufacturers can leave SMBIOS data blank, rounded, generic, or incorrectly configured. Some fields are manufacturer-defined, and values such as GPU adapter memory should not be treated as universally accurate. Microsoft discusses these limitations in its computer-information collection guidance. See the Get-ComputerInfo, Get-CimInstance, and Get-PhysicalDisk references for supported properties.
7. HWiNFO
Best for: the deepest general-purpose hardware inventory, live sensors, logging, and troubleshooting.
PC Slower Than It Used to Be?
A free scan shows the junk files, broken settings and background clutter dragging Windows down - then fixes them in one click.Free scan · Windows 10 & 11Crashes, No Sound, or Screen Glitches?
Random freezes, missing sound and display glitches usually trace back to one bad driver. Find and replace yours safely.Free scan · under a minuteDownload HWiNFO only from the official HWiNFO download page. The utility is designed to detect hardware and read the temperatures, clocks, voltages, usage values, and other sensor data that the platform exposes.
What HWiNFO can reveal
- CPU model, stepping, cores, clocks, and package information
- Motherboard, chipset, and BIOS or UEFI version
- RAM modules and timings
- PCIe link information
- GPU identity and sensors
- CPU and GPU temperatures
- Fan speeds and available voltage readings
- SSD, HDD, and NVMe temperatures and available health information
- Throttling, power-limit, and thermal indicators when the hardware exposes them
Recommended workflow
- Choose Summary-only for a quick component overview, Sensors-only for monitoring, or the full interface for both.
- Open the Summary window and confirm the major components.
- Open Sensors and identify CPU package temperature, effective clocks, GPU temperature and utilization, drive temperature, and throttling indicators.
- Enable sensor logging before reproducing a crash, freeze, thermal problem, or performance drop.
- Compare idle readings with readings during the actual workload.
HWiNFO is the best overall third-party choice when breadth matters, but its large number of sensors can overwhelm beginners. Sensor labels also need interpretation: CPU temperature, CPU package, core temperature, and Tctl/Tdie may represent different measurements. A missing sensor does not prove that the component has no physical sensor; it may simply not be exposed through the firmware, driver, bus, or controller.
Temperature and voltage readings are indicators, not universal safety verdicts. The correct limit depends on the exact CPU or GPU, workload, ambient temperature, firmware behavior, and manufacturer specification. HWiNFO detects what the platform reports; it cannot inspect every physically installed component or prove long-term stability.
8. CPU-Z
Best for: precise CPU, motherboard, chipset, RAM, and SPD identification in a compact interface.
Recommended Free Tools
Get CPU-Z from the official CPUID page. CPUID lists Windows 11 support and provides x86, x64, and ARM64 Windows versions. The page’s release number and date are volatile; the supplied research recorded version 2.20.2 dated June 4, 2026, so check the official page rather than relying on an old article.
Useful tabs
- CPU: model, codename, package, process, stepping, core voltage, clocks, cache, and instruction support.
- Caches: cache sizes and descriptors.
- Mainboard: motherboard manufacturer and model, chipset, BIOS vendor, version, date, and graphics interface.
- Memory: RAM type, total size, channel mode, current frequency, and timings.
- SPD: per-slot module manufacturer, part number, capacity, supported profiles, and timings.
- Graphics: basic graphics-adapter identification.
- About: report and validation options.
CPU-Z is particularly useful before a RAM upgrade. The SPD tab can identify the installed module in each slot, while the Memory tab shows how the memory is operating now. SPD describes supported profiles; it does not prove that a profile is enabled.
DDR memory can also look slower than the advertised number. A physical memory clock may be approximately half the effective DDR data rate because data transfers occur twice per clock cycle. BIOS settings, XMP or EXPO profiles, platform limits, and memory training affect the active speed.
CPU-Z is not a complete health monitor. It lacks HWiNFO’s broad sensor coverage and is not the right tool for detailed GPU telemetry or drive SMART data. It also cannot establish CPU stability. BIOS, chipset, virtualization, and firmware combinations may produce incomplete or unusual readings.
Download-security warning
Security reporting in April 2026 described a compromise of CPUID’s download infrastructure involving malicious redirections for CPU-Z and other CPUID utilities. Reports discussed affected downloads including CPU-Z 2.19 and said that the download-link issue was addressed; they did not establish that every current official file is malicious. Use the official page, verify the file’s digital signature and published SHA-256 hash when available, keep Microsoft Defender enabled, and avoid old installers from mirrors. The Broadcom bulletin, Securelist analysis, and SANS report provide the incident context.
Also popular on Amazon
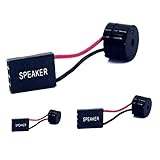
- [Quick PC Diagnostic Tool] Is your new PC build showing a black screen? This motherboard speaker translates silent hardware failures into clear BIOS beep codes. Instantly identify if your RAM, CPU, or GPU is causing the boot failure without guessing.
- [Essential for DIY PC Builders] Modern motherboards often lack built-in audio alerts. Plugging in this mini piezo buzzer before your first boot ensures you hear the satisfying “single beep” of a successful POST, giving builders immediate peace of mind.
- [Universal 4-Pin Header Compatibility] Wondering if it fits your board? It features a standard 4-pin female connector (with 2 active wires) that perfectly matches the “SPEAKER” or “SPK” front panel header on almost all ATX, Micro-ATX, and Mini-ITX motherboards.
- [Clean Wiring & Loud Alarm] Designed with an approx. 3-inch cable, it is long enough to easily plug into the motherboard but short enough to reduce PC case wiring clutter. The premium piezo element delivers a loud, crisp beep that is impossible to miss.
- [Valuable 3-Pack for IT Repair] Includes 3 internal BIOS buzzers in one pack. Perfect for IT technicians keeping spare diagnostic tools in their repair kits, or PC enthusiasts testing multiple rigs. A cost-effective solution to save hours of troubleshooting.
9. GPU-Z
Best for: detailed graphics-card identification and graphics-specific monitoring.
GPU-Z from TechPowerUp can report the GPU name, architecture, process technology, BIOS version, device ID, bus interface, shader information, memory type, memory size, bus width, driver, clocks, and supported graphics features.
Use it to verify
- The exact GPU model, codename, and revision
- Integrated versus discrete graphics
- VRAM type, capacity, and bus width
- PCIe bus interface and current link state
- BIOS and driver versions
- GPU and memory clocks
- Temperature, fan speed, load, and other supported sensors
GPU-Z is useful when a used graphics card’s label does not match the software identity, or when generic Windows tools provide only the adapter name and memory amount. Its detailed output can also reveal whether a card is operating on the expected bus interface.
Do not panic if the PCIe link shows a low speed while the PC is idle. Modern systems reduce link speed for power saving; check the link while the GPU is under load before concluding that it is operating incorrectly. Integrated graphics may use shared system memory rather than dedicated VRAM, and laptop GPUs often have OEM-specific power limits and names that do not map cleanly to desktop cards.
GPU-Z identifies and monitors the adapter; it does not prove gaming stability, cooling adequacy, power-supply capacity, or performance. Pair it with HWiNFO for broader temperatures and power behavior, Task Manager for workload utilization, and dxdiag for a support report. See the GPU-Z details reference for examples of the information it exposes.
10. CrystalDiskInfo
Best for: identifying HDDs, SSDs, and NVMe drives and reading their temperature and SMART or health data.
Download it from the official CrystalDiskInfo page. The project lists Windows 10 and 11 support, x86, x64, and ARM64 architectures, and NVMe support on Windows 10 or Windows Server 2016 and later. The supplied research recorded CrystalDiskInfo 9.9.2 dated July 25, 2026; release numbers change, so use the official page for the current build.
What to inspect
- Drive model and firmware
- Interface and transfer mode
- Temperature
- SMART attributes
- Reallocated sectors on supported hard drives
- Unsafe shutdowns on supported SSDs and NVMe drives
- Total host reads and writes when exposed
- SSD wear or percentage-used information when reported by the drive
- Power-on hours and power-cycle counts
- Overall health or warning state
CrystalDiskInfo is more informative than a simple free-space display because it can expose the drive’s own telemetry. However, a Good result does not guarantee that the drive will not fail. SMART attributes differ between vendors and drive types, and a health percentage is not a universal remaining-life prediction.
USB bridges, RAID controllers, storage drivers, and external enclosures may prevent complete SMART access. The official project says that only portions of USB, Intel RAID, and NVMe configurations are supported. If the data is missing, run the program as administrator, connect the drive directly through SATA or the motherboard’s NVMe slot if practical, try the drive manufacturer’s utility, check Get-PhysicalDisk, and review Windows storage errors. Back up important data before repairs or stress tests.
Also remember that SMART can remain normal while a drive has file-system corruption, intermittent disconnects, controller problems, or developing performance issues. Corroborate a warning with backups, Event Viewer storage errors, file-system checks, read/write errors, unexpected disconnects, and the manufacturer’s diagnostic tool.
Independent reader supportYour contribution helps us test, update, and keep practical guides available for everyone.Task-based recipes
Just want to know the PC’s specifications
- Open Settings > System > About for the model, CPU, RAM, Windows version, and system type.
- Open Task Manager > Performance for memory speed, disks, and basic GPU information.
- Use
msinfo32if you also need BIOS, physical-disk, driver, or problem-device details.
Need a support report
Use msinfo32 for a broad Windows inventory and export an .nfo or text report. Use dxdiag and click Save All Information when the problem involves a game, graphics driver, audio, or DirectX. HWiNFO can add a detailed hardware report and sensor log when the problem is thermal or performance-related.
Quick wins for a faster PC:
Scan for outdated or missing drivers - takes under a minuteDriver Scan →Clear out junk files and repair common Windows errorsFree Scan →Preparing to upgrade RAM
- Use Settings > About to confirm total installed RAM.
- Open Task Manager > Performance > Memory and note capacity, speed, form factor, and slots used if available.
- Open CPU-Z and inspect Memory and each SPD slot for module manufacturer, part number, capacity, and profiles.
- Cross-check the motherboard and current configuration with HWiNFO.
- Consult the computer or motherboard manufacturer for the maximum supported capacity, supported module types, and approved configurations. Software inventory alone cannot establish the platform’s upgrade limit.
Preparing to replace or troubleshoot a GPU
- Use GPU-Z to verify the exact adapter, VRAM, bus width, BIOS, and PCIe interface.
- Use Task Manager to observe utilization and dedicated versus shared memory.
- Use HWiNFO to monitor temperature, clocks, power, and throttling.
- Use Device Manager to check driver status and error codes.
- Inspect the physical card length, slot clearance, power connectors, airflow, and power-supply requirements before buying a replacement.
Investigating an overheating PC
- Run HWiNFO Sensors and log CPU, GPU, storage temperatures, clocks, fan speeds, and throttling indicators.
- Use Task Manager to identify the process or workload causing the heat.
- Use GPU-Z for graphics-specific temperature and load readings.
- Check OEM software, firmware settings, and relevant Windows events.
- Inspect fans, heatsinks, dust, airflow, fan curves, and thermal-interface material.
Do not apply one universal temperature limit. Safe operating limits differ by exact CPU or GPU model, firmware, ambient temperature, and workload. Compare readings with the manufacturer’s specifications.
Checking whether a drive may be failing
- Back up important files immediately.
- Use CrystalDiskInfo or the drive manufacturer’s utility to inspect SMART data and warnings.
- Check Event Viewer for storage, controller, or unexpected-disconnect errors.
- Look for file-system corruption, read/write errors, sudden slowdowns, and disappearing drives.
- Replace the drive if diagnostics, errors, or behavior indicate a problem; do not wait for a health percentage to reach zero.
Inventorying several computers
Use PowerShell CIM queries and export structured results to CSV. This is more repeatable than screenshots and makes it easier to compare processors, RAM modules, BIOS versions, disks, and graphics adapters across machines. Remote queries still require appropriate permissions and network configuration.
Also popular on Amazon
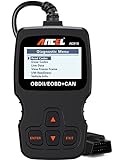
- CEL Doctor: The ANCEL AD310 is one of the best-selling OBD II scanners on the market and is recommended by Scotty Kilmer, a YouTuber and auto mechanic. It can easily determine the cause of the check engine light coming on. After repairing the vehicle's problems, it can quickly read and clear diagnostic trouble codes of emission system, read live data & hard memory data, view freeze frame, I/M monitor readiness and collect vehicle information
- Sturdy and Compact: Equipped with a 2.5 foot cable made of very thick, flexible insulation. It is important to have a sturdy scanner as it can easily fall to the ground when working in a car. The AD310 OBD2 scanner is a well-constructed mechanic tool with a sleek design. It weighs 12 ounces and measures 8.9 x 6.9 x 1.4 inches. Thanks to its compact design and light weight, transporting the device is not a problem. The buttons are clearly labelled and the screen is large and displays results clearly
- Accurate Fast and Easy to Use: The AD310 scanner can help you or your mechanic understand if your car is in good condition, provides exceptionally accurate and fast results, reads and clears engine trouble emission codes in seconds after you fixed the problem. This device will let you know immediately and fix the problem right away without any car knowledge. No need for batteries or a charger, get power directly from the OBDII Data Link Connector in your vehicle
- OBDII Protocols and Car Compatibility: Many cheap scan tools do not really support all OBD2 protocols. AD310 scanner as it can support all OBDII protocols such as KWP2000, J1850 VPW, ISO9141, J1850 PWM and CAN. This device also has extensive vehicle compatibility with 1996 US-based, 2000 EU-based and Asian cars, light trucks, SUVs, as well as newer OBD2 and CAN vehicles both domestic and foreign. Pls confirm with our customer service whether it is compatible with your vehicle before purchasing
- Home Necessity and Worthy to Own: This is an excellent code reader to travel or home with as it weighs less and it is compact in design. You can easily slide it in your backpack as you head to the garage, or put it on the dashboard, this will be a great fit for you. The AD310 is not only portable, but also accurate and fast in performance. Moreover, it covers various car brands and is suitable for people who just need a code reader to check their car
Working without third-party software
Use Settings, Task Manager, msinfo32, Device Manager, dxdiag, PowerShell, and the optional systeminfo command. This combination covers basic specifications, activity, drivers, reports, DirectX, and scriptable inventory, although it will not match HWiNFO’s sensor depth, GPU-Z’s graphics detail, or CrystalDiskInfo’s convenient SMART view.
When hardware data differs between tools
Different output does not automatically mean that one application is broken. Tools may read different data sources, including SMBIOS, WMI, PCI configuration space, driver APIs, or sensors. Other common causes include:
The Tool Desk
Outbyte Driver Updater FREEFix the driver behind crashes, sound loss and screen glitchesFind Drivers →Outbyte PC Repair FREEClear out junk files and repair common Windows errorsFree Scan →- Decimal versus binary capacity units
- Shared versus dedicated GPU memory
- Current, base, boost, and effective clock differences
- Manufacturer rounding or generic firmware strings
- Virtualization, remote desktop, or hybrid graphics
- Different sensor labels and measurement locations
- Firmware bugs or incomplete device-driver support
Use the specialist for the question: CPU-Z for RAM SPD, GPU-Z for GPU identity, CrystalDiskInfo for drive telemetry, HWiNFO for sensors, Device Manager for Windows driver status, and msinfo32 for a broad Windows report. No single application should be treated as universally authoritative.
What these tools cannot reliably check
Software can identify a motherboard and report some voltage or temperature sensors, but it cannot fully verify every physical slot, PCB trace, capacitor, socket pin, USB or SATA port, VRM, or connector. It normally cannot identify the exact power-supply model or verify true PSU output quality under load. PSU diagnosis may require manufacturer documentation, a known-good replacement, a PSU tester, a properly used multimeter, or professional equipment.
Likewise, a specification viewer does not perform a complete CPU, GPU, RAM, or disk stability test. Stress testing can introduce additional risk, especially with a failing drive or inadequate cooling, so back up data first and use hardware-specific procedures. Physical inspection remains necessary for loose cables, blocked fans, damaged connectors, dust, bent pins, and other faults software cannot see.
Safe-download checklist
Third-party tools add useful detail but should be obtained carefully. An official domain is the right starting point, not an absolute guarantee: the 2026 CPUID download-chain incident demonstrates why verification matters.
What’s actually slowing this PC down?
Pick the symptom - the matching free tool is one click away.
- Use the developer’s official download page.
- Prefer a portable archive when the developer provides one and you do not need installation.
- Check the file’s digital signature.
- Compare its SHA-256 hash when the developer publishes one.
- Scan it with Microsoft Defender and, where appropriate, a second reputable scanner.
- Avoid driver-updater sites, download aggregators, and old installers from mirrors.
- Do not disable SmartScreen or antivirus merely to run a hardware utility.
- Do not run a low-level utility as administrator unless it genuinely requires that access.
HWiNFO, CPU-Z, GPU-Z, and CrystalDiskInfo are read-oriented utilities for ordinary inventory and monitoring. Avoid advanced register-level tools unless you understand their risks. RWEverything, for example, warns that it can modify hardware settings and that incorrect use may damage a system, so it is not an appropriate general recommendation for checking PC specifications.
Privacy before sharing a report
Hardware reports can contain more than component names. Before posting one publicly, redact the computer name, username or registered owner, serial numbers, Windows activation or product information, IP or network details, device identifiers, and any installed-software information that you do not want to disclose.
Copy-and-paste command appendix
System Information
msinfo32 /report "%USERPROFILE%Desktophardware-report.txt"msinfo32 /nfo "%USERPROFILE%Desktophardware-report.nfo"Command Prompt inventory
systeminfosysteminfo /fo csv > "%USERPROFILE%Desktopsysteminfo.csv"systeminfo /fo list > "%USERPROFILE%Desktopsysteminfo.txt"systeminfo /s COMPUTERNAMEMicrosoft documents systeminfo for Windows 10 and Windows 11. Its output includes operating-system configuration and hardware properties such as RAM, disk space, and network cards. Remote use requires suitable access and network configuration.
PowerShell inventory
Get-ComputerInfo | Out-File ($env:USERPROFILE + 'Desktopcomputer-info.txt')Get-CimInstance Win32_Processor | Select-Object Name, NumberOfCores, NumberOfLogicalProcessors, MaxClockSpeedGet-CimInstance Win32_PhysicalMemory | Select-Object Manufacturer, PartNumber, Capacity, Speed, DeviceLocatorGet-CimInstance Win32_BIOS | Select-Object Manufacturer, SMBIOSBIOSVersion, ReleaseDate, SerialNumberGet-CimInstance Win32_DiskDrive | Select-Object Model, InterfaceType, MediaType, SerialNumber, SizeGet-PhysicalDisk | Select-Object FriendlyName, MediaType, Size, HealthStatus, OperationalStatusBottom line
For a quick answer, use Settings and Task Manager. For a complete built-in report, use msinfo32, Device Manager, and dxdiag. For repeatable inventory, use PowerShell CIM queries. For deeper third-party information, HWiNFO is the best broad utility, while CPU-Z, GPU-Z, and CrystalDiskInfo are the focused choices for RAM and motherboard details, graphics cards, and storage health.
Do these 3 things before closing this tab:
1Scan for outdated or missing drivers - takes under a minute2Repair Windows errors before they cause bigger problems3Fix the driver behind crashes, sound loss and screen glitchesTogether these tools expose almost every useful software-visible hardware detail in a Windows PC. They still cannot guarantee component health, identify every physical fault, or replace backups, appropriate stress testing, manufacturer documentation, and physical inspection.
Frequently Asked Questions
Can Windows detect every component installed in a PC?
No. Results depend on firmware and SMBIOS quality, drivers, virtualization, USB or RAID controllers, OEM customization, and whether the device is connected or disabled. A blank or generic value can reflect incomplete manufacturer data rather than failed hardware.
What is the best single tool for checking Windows hardware?
HWiNFO is the best single third-party choice for breadth, component detection, sensors, monitoring, and logging. It can be overwhelming, so use Settings or msinfo32 for a simpler report and CPU-Z, GPU-Z, or CrystalDiskInfo when you need specialist information.
Can a hardware-information utility test my power supply?
Not reliably. Software voltage readings may be incomplete or inaccurate, and they generally cannot identify the exact PSU or verify its true output quality under load. Use documentation, known-good replacement hardware, a PSU tester, properly used electrical test equipment, or professional service.
Free tools Windows power users keep installed
One-click scans. No signup required.
Does a CrystalDiskInfo Good status guarantee that an SSD or hard drive is healthy?
No. It means the available SMART and vendor-reported indicators are not currently warning, but SMART attributes vary and can miss file-system corruption, controller faults, intermittent disconnects, or future failure. Keep backups and corroborate with Windows errors and the manufacturer’s diagnostics.
The Bottom Line
Use the right tool for the right question: Settings for basic specifications, msinfo32 for reports, Device Manager for drivers, Task Manager for live usage, HWiNFO for sensors, CPU-Z for RAM and motherboard details, GPU-Z for graphics, and CrystalDiskInfo for drive telemetry. No software-only checklist can prove that every physical component is healthy.

