
Recommended Free Tools
iTechGuides is reader-supported. When you buy through links on our site, we may earn an affiliate commission. As an Amazon Associate I earn from qualifying purchases. Learn more
The best network monitoring software depends on what you need to watch and how you want to operate it. A small office with switches, firewalls, and access points may need reliable SNMP polling and simple alerts. An enterprise may also need flow analysis, path testing, topology maps, application telemetry, cloud visibility, and distributed collectors.
PRTG Network Monitor is the strongest general choice for many small and midsize on-premises networks. Zabbix is the best open-source option, while Datadog is better when network data must be correlated with applications, logs, cloud services, and traces. MSPs should look closely at Auvik, and organizations wanting traditional enterprise network analysis should consider SolarWinds Network Performance Monitor.
Best network monitoring software at a glance
| Best for | Software | Why choose it |
|---|---|---|
| Most small and midsize on-premises networks | Paessler PRTG Network Monitor | Fast deployment, broad sensor library, SNMP and flow monitoring, maps, alerts, and hosted or self-hosted options |
| Open-source customization | Zabbix | No device or metric license limits; supports agents, SNMP, proxies, templates, discovery, dashboards, and alerting |
| Network and server monitoring together | ManageEngine OpManager | Device-based licensing, automatic discovery, device templates, interface monitoring, reporting, and mobile apps |
| Network plus application and cloud observability | Datadog | Combines SNMP network data with infrastructure, applications, logs, traces, cloud services, and NetFlow |
| Deep traditional network analysis | SolarWinds Network Performance Monitor | Network-path analysis, performance correlation, mapping, alerting, and hybrid/on-premises coverage |
| Cloud-managed and MSP-style operations | Auvik | Cloud-hosted discovery and monitoring with billing based on billable managed devices |
| Plugin ecosystem and perpetual licensing | Nagios XI | Node-based licensing, configuration wizards, extensive plugins, reporting, and distributed monitoring |
1. Paessler PRTG Network Monitor: best overall for straightforward monitoring
PRTG is a practical choice when you need to monitor switches, routers, firewalls, bandwidth, uptime, hardware health, virtual machines, applications, databases, cloud services, QoS, and VoIP from one interface. You can run PRTG Network Monitor in your own environment, or use PRTG Hosted Monitor, where Paessler operates the core server and hosted probe.
To open the main working area, select Devices from the main menu. The device tree is where you add devices, groups, sensors, and monitoring relationships.
Popular on Amazon

- GIGABIT ETHERNET PORTS: Features 5 x 1.0Gbps Ethernet ports for high-speed connectivity. Auto-negotiating ports detect the optimal speed for connected devices and work with existing Cat5e or Cat6 Ethernet cables.
- PLUG-AND-PLAY UNMANAGED NETWORK SWITCH: Simple plug-and-play setup with no software to install or configuration required.
- FLEXIBLE MOUNTING OPTIONS: Compact metal design supports desktop or wall-mount placement for versatile installation.
- SILENT & ENERGY-EFFICIENT OPERATION: Fanless design ensures silent performance, while IEEE 802.3az Energy Efficient Ethernet reduces power consumption without compromising high-speed network performance.
- REGIONAL COMPATIBILITY: Made for use in U.S. & CA only
How PRTG licensing works
PRTG counts sensors, not devices. A sensor monitors one aspect of a device or service—for example, a switch port, CPU load, URL, or traffic connection. Paessler estimates that a typical device needs about five to ten sensors. The freeware edition supports up to 100 sensors, while commercial tiers include 500, 1,000, 2,500, 5,000, and 10,000 sensors.
That makes a “100-device network” an inadequate basis for estimating cost. One device might need only ping and a few SNMP sensors; another may require sensors for dozens of interfaces, traffic flows, hardware components, and services.
PRTG limitations to know
- The free edition is limited to 100 sensors, not 100 devices.
- Different license sizes cannot simply be combined on one core server. Buying 500 and 1,000 sensors does not create a 1,500-sensor installation.
- Flow, VMware, WMI, Syslog, and trap sensors generally consume more resources than basic ping and SNMP sensors.
- Large deployments exceeding 10,000 sensors may need additional core installations or PRTG Enterprise Monitor.
- Offline installations require manual license reactivation once per year or when the subscription expires, whichever comes first.
When SNMP sensors intermittently time out, check that SNMP is enabled, the version and credentials are correct, UDP port 161 is permitted, and the firewall has a return path. In PRTG, increasing SNMP Delay (ms) can help with slow devices. Leave Failed Requests set to Retry when temporary timeouts are expected.
2. Zabbix: best open-source network monitoring platform
Zabbix is the best fit when avoiding license fees matters less than having control over templates, triggers, dashboards, APIs, data retention, and collection architecture. The software is free to deploy and use in production. It has no device or metric license limit. Paid subscriptions provide support, response-time guarantees, long-term maintenance, and expert services rather than making the core product usable.
Zabbix supports SNMP, agents, IPMI, JMX, web checks, proxies, templates, low-level discovery, dashboards, triggers, and APIs. A Zabbix host can represent a physical device, virtual machine, application, service, or other monitored entity; it does not have to be a physical computer.
Adding a device in Zabbix
- Go to Data collection > Hosts.
- Click Create host, or use Host Wizard in the upper-right corner.
- Assign the host to at least one host group.
- Add the required interface: Agent, SNMP, JMX, or IPMI.
- Link the relevant templates and configure macros or device-specific settings.
- Click Add or Create.
Host groups are mandatory because permissions are assigned to groups rather than individual hosts. For remote sites, a Zabbix proxy can collect data locally and forward it to the server.
Zabbix pitfalls
Use packages from the official Zabbix repository rather than assuming your Linux distribution provides the current version. Distribution packages can lag behind and may not include recent fixes.
What’s actually slowing this PC down?
Pick the symptom - the matching free tool is one click away.
Also popular on Amazon
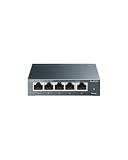
- 𝗢𝗻𝗲 𝗦𝘄𝗶𝘁𝗰𝗵 𝗠𝗮𝗱𝗲 𝘁𝗼 𝗘𝘅𝗽𝗮𝗻𝗱 𝗡𝗲𝘁𝘄𝗼𝗿𝗸: 5× 10/100/1000Mbps RJ45 Ports supporting Auto Negotiation and Auto MDI/MDIX.
- 𝗚𝗶𝗴𝗮𝗯𝗶𝘁 𝘁𝗵𝗮𝘁 𝗦𝗮𝘃𝗲𝘀 𝗘𝗻𝗲𝗿𝗴𝘆: Latest innovative energy-efficient technology greatly expands your network capacity with much less power consumption and helps save money.
- 𝗥𝗲𝗹𝗶𝗮𝗯𝗹𝗲 𝗮𝗻𝗱 𝗤𝘂𝗶𝗲𝘁: IEEE 802.3X flow control provides reliable data transfer and Fanless design ensures quiet operation.
- 𝗣𝗹𝘂𝗴 𝗮𝗻𝗱 𝗣𝗹𝗮𝘆: Easy setup with no software installation or configuration needed.
- 𝗔𝗱𝘃𝗮𝗻𝗰𝗲𝗱 𝗦𝗼𝗳𝘁𝘄𝗮𝗿𝗲 𝗙𝗲𝗮𝘁𝘂𝗿𝗲𝘀: Prioritize your traffic and guarantee high quality of video or voice data transmission with Port-based 802.1p/DSCP QoS and IGMP Snooping.
Passive agent checks also have two easy-to-miss requirements: the agent’s Hostname must match the host name configured in Zabbix, and the agent’s Server directive must permit the Zabbix server or proxy address.
SNMP bulk requests reduce network traffic, but some devices fail when max repetitions is too high. Reduce that value if bulk polling is unreliable. A failed SNMP check can retry up to five times; with a three-second timeout, an unreachable device may take approximately 15 seconds to complete a check.
The Zabbix appliance is useful for evaluation, but it is not intended as the foundation for a serious production deployment.
3. ManageEngine OpManager: best for integrated network and server monitoring
OpManager combines network discovery, real-time device and interface monitoring, alarms, reports, troubleshooting tools, and mobile applications. Its device-based licensing is easier to forecast than a sensor-based model when you want broad monitoring across each managed device.
Use these menu paths to begin:
- Settings > Discovery > Device credentials to add SNMP and other credentials.
- Settings > Discovery > Add Device/Server to add one device.
- Settings > Discovery > Network Discovery to discover a range, subnet, or larger network.
- Inventory to review discovered devices.
A basic ICMP or TCP availability check may work without credentials, but SNMP-based availability and performance monitoring requires valid credentials. Discovery alone also does not guarantee complete monitoring. The selected credential, device template, discovery rule, and assigned monitors determine which metrics OpManager collects.
Discovery failures commonly result from blocked firewall or antivirus ports. SNMP normally uses UDP port 161. SNMPv3 adds further failure points, including an incorrect context name, authentication or privacy mismatch, invalid engine boot values, duplicate SNMP engine IDs, and unsupported encryption. OpManager does not support AES-192.
4. Datadog: best for network-plus-application observability
Datadog is a strong choice when a network incident cannot be separated from the application running on it. Its Network Device Monitoring uses SNMP to discover and monitor routers, switches, firewalls, and similar equipment. Network data can be viewed alongside infrastructure metrics, applications, logs, traces, cloud services, network paths, wireless access points, and NetFlow.
Also popular on Amazon
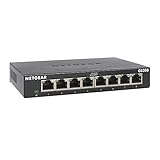
- GIGABIT ETHERNET PORTS: Features 8 x 1.0Gbps Ethernet ports for high-speed connectivity. Auto-negotiating ports detect the optimal speed for connected devices and work with existing Cat5e or Cat6 Ethernet cables.
- PLUG-AND-PLAY UNMANAGED NETWORK SWITCH: Simple plug-and-play setup with no software to install or configuration required.
- FLEXIBLE MOUNTING OPTIONS: Compact metal design supports desktop or wall-mount placement for versatile installation.
- SILENT & ENERGY-EFFICIENT OPERATION: Fanless design ensures silent performance, while IEEE 802.3az Energy Efficient Ethernet reduces power consumption without compromising high-speed network performance.
- REGIONAL COMPATIBILITY: Made for use in U.S. & CA only
This approach helps answer questions such as “Is the API slow because of the application, a cloud service, or a particular network hop?” Traditional SNMP tools can answer whether an interface is up and how much traffic it carries, but usually need separate integrations for application and transaction health.
Datadog pricing is divided into multiple units
US list pricing billed annually includes $7 per network device per month for Network Device Monitoring, $5 per network host per month for Cloud Network Monitoring, and $5 per 1,000 Network Path tests per month. Wireless Access Point Monitoring is listed at $4 per device per month. NetFlow Monitoring ranges from $0.60 to $0.85 per million aggregated records per month depending on retention.
These charges are separate from possible Infrastructure Monitoring, logs, APM, and indexed-data costs. Datadog is therefore less attractive when the requirement is simply inexpensive SNMP polling for switches and routers. It is more compelling when the organization already uses Datadog or needs a unified observability workflow.
5. SolarWinds Network Performance Monitor: best for traditional enterprise analysis
SolarWinds Network Performance Monitor focuses on detailed network performance and troubleshooting. Its capabilities include NetPath hop-by-hop analysis, intelligent mapping, PerfStack metric correlation, AlertStack, anomaly-based alerting, customizable dashboards, and hybrid on-premises monitoring.
SolarWinds now positions NPM as a core feature of SolarWinds Observability Self-Hosted. NPM features are also available as a standalone Orion module, but pricing is quote-based. Older comparisons that present NPM as a completely separate product with one simple public price are no longer reliable.
Quick wins for a faster PC:
Clear out junk files and repair common Windows errorsFree Scan →Scan for outdated or missing drivers - takes under a minuteDriver Scan →Repair Windows errors before they cause bigger problemsFix Now →Choose SolarWinds when network teams need deep path analysis, dependency views, topology information, and correlation across many traditional network-management metrics. It is usually more platform than a small office needs.
6. Auvik: best cloud-managed option for MSPs
Auvik is a cloud network-management platform designed for organizations and managed service providers that want discovery, inventory, monitoring, and visibility without maintaining a central monitoring server.
Also popular on Amazon
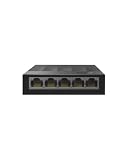
- 【One Switch Made to Expand Network】Features 5 RJ45 ports with 10/100/1000Mbps speeds, supporting Auto-Negotiation and Auto MDI/MDIX for hassle-free setup. Ideal for expanding your network, with 1 uplink (input) port and 4 output ports to split your Ethernet connection to multiple devices.
- 【Gigabit that Saves Energy】Latest innovative energy-efficient technology greatly expands your network capacity with much less power consumption and helps save money
- 【Reliable and Quiet】IEEE 802.3X flow control provides reliable data transfer and Fanless design ensures quiet operation
- 【Plug and Play】Easy setup with no software installation or configuration needed
- 【Ethernet Splitter】Connect to your router or modem for additional wired connections (laptop, gaming console, printer, etc)
Its billing model is based on billable managed devices across networks, not every endpoint Auvik discovers or monitors. Many endpoints, printers, access points, and IoT devices may therefore be visible without each becoming a separately billed device.
Auvik is particularly suitable for MSPs managing many customer networks, distributed organizations, and teams that prefer SaaS operations. Pricing depends on device classification and selected modules, so third-party “starting at” prices should not be treated as definitive. Request a quote based on the actual number of billable devices.
Do these 3 things before closing this tab:
1Scan for outdated or missing drivers - takes under a minute2Clear out junk files and repair common Windows errors3Fix the driver behind crashes, sound loss and screen glitches7. Nagios XI: best for plugins and perpetual licensing
Nagios XI uses node-based licensing. A node is an IP address or fully qualified domain name representing a monitored host, router, switch, firewall, workstation, or other device. Paid plans do not impose a software limit on the number of services monitored per node.
The public pricing page lists a free edition limited to seven nodes or 100 services, whichever is reached first. Standard perpetual licenses include 100 nodes for $2,595, 200 nodes for $4,395, 500 nodes for $8,295, and 1,000 nodes for $14,995. Enterprise pricing is higher, starting at $4,690 for 100 nodes. Maintenance and support are separate after the included period.
Nagios is attractive when an organization already has custom checks or needs its large plugin ecosystem. It is less turnkey than products that automatically discover and template a network.
Plan carefully for scale: Nagios recommends following its sizing guidance for installations running more than approximately 15,000 to 20,000 checks per five-minute interval. Premium features such as Azure AD SSO, Mod-Gearman, and premium wizards require renewed maintenance and support after the first year.
What to compare before choosing
SNMP versions
Prefer SNMPv3 when supported by both the monitoring platform and the device. SNMPv1 sends the community string in plaintext and uses 32-bit interface counters, which can wrap on fast links. SNMPv2 adds 64-bit counters and GetBulk. SNMPv3 adds authentication and encryption.
Also popular on Amazon

- 𝗘𝗶𝗴𝗵𝘁 𝟮.𝟱 𝗚𝗯𝗽𝘀 𝗣𝗼𝗿𝘁𝘀 𝗳𝗼𝗿 𝗦𝘂𝗽𝗲𝗿-𝗙𝗮𝘀𝘁 𝗖𝗼𝗻𝗻𝗲𝗰𝘁𝗶𝗼𝗻𝘀: 8× 2.5-Gigabit ports unlock the highest performance of your Multi-Gig bandwidth and devices, and provide up to 40 Gbps of switching capacity.
- 𝗔𝘂𝘁𝗼-𝗡𝗲𝗴𝗼𝘁𝗶𝗮𝘁𝗶𝗼𝗻: Auto-negotiation intelligently senses the link speeds and adjusts between 3-speeds (100Mb/1G/2.5G) for compatibility and optimal performance for all your devices, including 2.5G WiFi 6 AP, 2.5G NAS, 2.5G PCIe Adapter, 2.5G Server, gaming computer, 4K video, and more.
- 𝗜𝗱𝗲𝗮𝗹 𝗳𝗼𝗿 𝗩𝗮𝗿𝗶𝗼𝘂𝘀 𝗦𝗰𝗲𝗻𝗮𝗿𝗶𝗼𝘀: Built for LAN parties, home entertainment, small and home offices, and instant transfer for workstations.
- 𝗛𝗮𝘀𝘀𝗹𝗲-𝗙𝗿𝗲𝗲 𝗖𝗮𝗯𝗹𝗶𝗻𝗴: Instantly upgrade to 2.5 Gbps without the need to upgrade to Cat6 wiring, reducing wiring costs and hassle. *
- 𝗦𝗶𝗹𝗲𝗻𝘁 𝗢𝗽𝗲𝗿𝗮𝘁𝗶𝗼𝗻: Industry-leading fanless design ensures silent operation, ideal for any home or business.
Polling and traps
Polling checks a device at scheduled intervals and builds a time series. SNMP traps and informs send event-driven notifications. Traps can reduce detection delay, but they should supplement polling rather than replace it: a trap does not provide a complete history of interface utilization, errors, latency, or availability.
Flow monitoring
SNMP reports device and interface counters. NetFlow, sFlow, jFlow, and IPFIX provide traffic-flow details such as top talkers, protocols, applications, and destinations. Flow monitoring is considerably more resource-intensive than basic ping or SNMP polling, so confirm collector capacity and retention requirements.
Remote collection
Remote probes and proxies matter when branches are separated by firewalls, unreliable WAN links, or strict security boundaries. PRTG uses remote and hosted probes; Zabbix uses proxies; Nagios supports distributed monitoring; Datadog uses collection components and cloud ingestion rather than a conventional central polling server.
Windows Errors? Fix Them Before They Spread
Repair common Windows errors and clear accumulated junk for a smoother, more stable PC - no reinstall needed.Free scan · no reinstallOutdated Drivers Are Slowing You Down
One free scan finds every outdated or missing driver and matches the right update for your exact hardware.Free scan · exact hardware matchLicensing units
| Product | Primary licensing unit |
|---|---|
| PRTG | Sensors |
| Zabbix | No software license limit; subscriptions cover support |
| OpManager | Devices |
| Datadog | Devices, hosts, tests, records, and separate observability products |
| SolarWinds NPM | Quote-based product or module licensing |
| Auvik | Billable managed devices |
| Nagios XI | Nodes |
Common buying mistakes
- Confusing PRTG sensors with devices: 100 free sensors may cover only about ten typical devices, depending on sensor density.
- Assuming Zabbix requires a production license: the software is free; paid subscriptions are for support and operational assurance.
- Treating discovery as full monitoring: OpManager still needs the right credentials, templates, rules, and monitors.
- Budgeting Datadog as one flat per-host charge: network devices, cloud hosts, path tests, wireless access points, NetFlow, logs, APM, and infrastructure monitoring use different billing units.
- Assuming device monitoring proves application health: an interface can be up while a database, API, or transaction is failing.
- Assuming correct SNMPv3 credentials are enough: context names, engine IDs, boot values, encryption support, and firewall rules can still block collection.
FAQ
What is the best network monitoring software for a small business?
PRTG Network Monitor is the best starting point for many small businesses because it is quick to deploy and covers SNMP, bandwidth, uptime, alerts, maps, and other common requirements. Estimate the number of sensors—not just devices—before selecting a license.
What is the best free network monitoring software?
Zabbix is the strongest free and open-source choice when you can manage installation, configuration, updates, and troubleshooting yourself. It has no software license limit on devices or metrics, although paid support subscriptions are available.
Is PRTG free for 100 devices?
No. PRTG’s freeware edition supports up to 100 sensors. A sensor monitors one aspect, such as a port, CPU load, URL, or traffic connection, so the free edition may cover far fewer than 100 devices.
Should I choose SNMP monitoring or a full observability platform?
Choose SNMP-focused software when you mainly need device availability, interface health, bandwidth, hardware status, and alerts. Choose a platform such as Datadog when you also need to correlate network behavior with applications, logs, cloud services, traces, and infrastructure metrics.
The Tool Desk
Outbyte Driver Updater FREEScan for outdated or missing drivers - takes under a minuteDriver Scan →Outbyte PC Repair FREEClear out junk files and repair common Windows errorsFree Scan →The Bottom Line
For most small and midsize on-premises environments, choose PRTG Network Monitor if you want a fast, visual deployment and can model the sensor count accurately. Choose Zabbix for maximum flexibility without software licensing fees, OpManager for integrated network and server monitoring, and Datadog when network data must be investigated alongside applications and cloud services. Auvik is the most natural fit for cloud-managed MSP operations, while SolarWinds NPM and Nagios XI suit teams with deeper traditional monitoring requirements.
Before buying, test the product against your actual devices, SNMPv3 configuration, remote sites, flow volume, alerting rules, retention needs, and licensing unit. Those details determine whether a tool remains affordable and useful after deployment.

