
SAS Visual Analytics
SAS Visual Analytics: A broad BI environment for organizations combining dashboards with advanced analytics. Ranked #11 of 88 in Business Intelligence Tools by our editors (8.4/10); pricing: Pricing on request; best for organizations needing predictive and location analytics.
At a glance
- Editor score8.4 / 10
- PricingPricing on request
- Best forOrganizations needing predictive and location analytics
- DeploymentHybrid
- Founded1976 · Cary, North Carolina, United States
- Facts checked21 Sep 2026
Where it wins
- Combines dashboards, data preparation, predictive and geographic analytics
- Supports scheduled distribution, embedded analytics and hybrid deployment
- Adds natural-language exploration through SAS Viya Copilot
Where it doesn't
- Pricing requires a sales conversation
- Its broad feature set may exceed basic dashboard needs
- Advanced analytics are centered within the SAS environment
Our verdict on SAS Visual Analytics
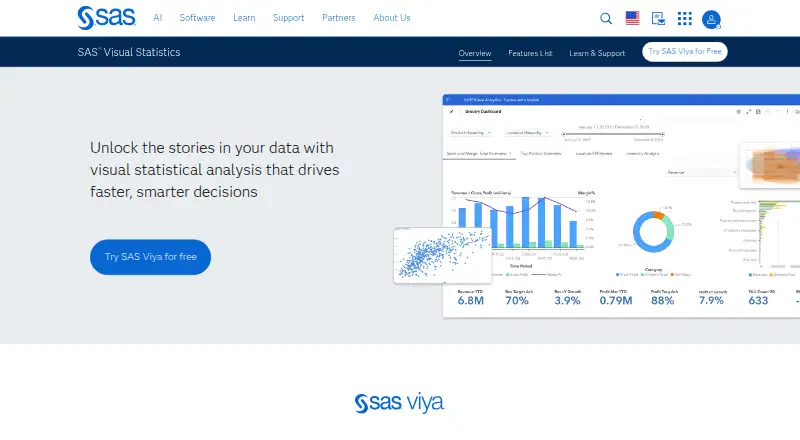
SAS Visual Analytics is a business intelligence and analytics application for organizations, business analysts, report designers and decision-makers. It brings interactive reports, dashboards, visual exploration, self-service data preparation, predictive analytics, forecasting, scenario analysis, location analytics, and text and sentiment analytics into one environment. Web, iOS and Android access, along with API support, suits teams sharing insights across business and application contexts. Its positioning is strongest for organizations that need more than descriptive reporting, particularly predictive and geographic analysis.
Pricing follows a contact-sales model, so the buying process begins with a licensing discussion rather than a published standard plan structure. The product supports hybrid deployment and connects with Microsoft 365 and Microsoft Teams. Reports can be distributed on schedules by email and Microsoft Teams, while the SAS Viya SDK for JavaScript, REST APIs, D3 and C3 support embedded analytics and custom web applications. These options make SAS Visual Analytics relevant for teams that need analytics inside existing workflows or customer-facing software, not only in a standalone dashboard.
The product’s main distinction is breadth: users can prepare data, explore it visually, build dashboards, apply predictive and forecasting methods, analyze locations, examine text and sentiment, and use SAS Viya Copilot for natural-language dashboard and data exploration assistance. That range makes it a stronger fit for organizations with varied analytics requirements than for teams seeking a narrowly focused reporting tool. Choose SAS Visual Analytics when advanced analytics, scheduled distribution, embedding and hybrid access matter together. A simpler dashboard requirement may not justify its wider scope or sales-led purchasing process.
Your product? Our editors can test SAS Visual Analytics in depth and publish a review, labelled as paid · from $149/mo →
SAS Visual Analytics pricing
SAS Visual Analytics fact sheet
| Free plan | Not verified |
|---|---|
| Paid from | Not verified |
| Deployment | Hybrid |
| Refresh frequency | Not verified |
| Row-level security | Yes |
| Scheduled reports | Yes |
| Viewer seats | Not verified |
| Embedded analytics | Yes |
| Natural-language queries | Yes |
| Deployment | Cloud, Self-hosted |
| Platforms | Web, iOS, Android |
| Support | Community, Tickets, Docs |
| Built for | Mid-market, Enterprise (editorial estimate) |
| Integrations | 5 integrations: Microsoft 365, REST APIs, D3.js, C3.js, SAS Visual Analytics SDK |
| Pricing | Pricing on request |
| Website | sas.com |
| Facts checked | 21 Sep 2026 |
SAS Visual Analytics integrations
SAS Visual Analytics lists 5 integrations on its own site.
- Microsoft 365
- REST APIs
- D3.js
- C3.js
- SAS Visual Analytics SDK
Alternatives to SAS Visual Analytics
- Microsoft Power BIA broad BI platform for Microsoft-centric teams that need modeling, security, sharing, and embedding.9.4
- TableauA broad BI platform for teams that need deep visualization and governed analytics.9.3
- Zoho AnalyticsA flexible, affordable BI platform with broad connectors and practical AI features.9.2


See all SAS Visual Analytics alternatives →
Also Ranked In
SAS Visual Analytics is ranked in 11 of our directories; the 6 strongest besides Business Intelligence Tools.
Used SAS Visual Analytics? Be the first to review it
The editor score above is our own research. What this page doesn't have yet is a reader's view — what you used SAS Visual Analytics for, what worked and what didn't. No stars are seeded and no review is paid for; an editor reads every one before it appears.
Write a reviewTwo minutes · verified accounts only · read by an editor before it appears
Featured on iTechGuides

SAS Visual Analytics is listed in our Business Intelligence Tools directory. Add the badge to your site — it links back to this page.
<a href="https://www.itechguides.com/products/sas-visual-analytics/"><img src="https://www.itechguides.com/best/badge/sas-visual-analytics.svg" alt="Featured on iTechGuides" width="230" height="46"></a>
Reviewed by iTechGuides Editors · Editorial team · Updated Oct 2026
Advertiser disclosure: iTechGuides is reader-supported. Vendors can pay for top positions in our rankings and for a place on other products' pages, and we may earn a commission when you click some links. Bought places stand at the number bought; this page and our disclosure say so. Paying vendors may get a fuller, more detailed review from our editors, and that review can change their score. How we rank.
Last updated · How we research and update