Prometheus Node Exporter
Prometheus Node Exporter: A focused, open-source exporter for Linux hardware metrics, not a complete monitoring console. Ranked #57 of 59 in Hardware Monitoring Software by our editors (4.3/10); pricing: Open source; best for prometheus-based Linux hardware metrics.
At a glance
- Editor score4.3 / 10
- PricingOpen source
- Best forPrometheus-based Linux hardware metrics
- Paid fromFree
- Remote monitoringYes
- Facts checked19 Sep 2026
Where it wins
- Exports CPU, memory, disk, network, thermal, and sensor metrics
- Pluggable collectors with enable, disable, include, and exclude flags
- Supports custom textfile metrics and Docker deployment
Where it doesn't
- Requires Prometheus or another surrounding system for scraping and retention
- Does not provide a complete monitoring console
- Alerting and notification channels are outside Node Exporter
Our verdict on Prometheus Node Exporter
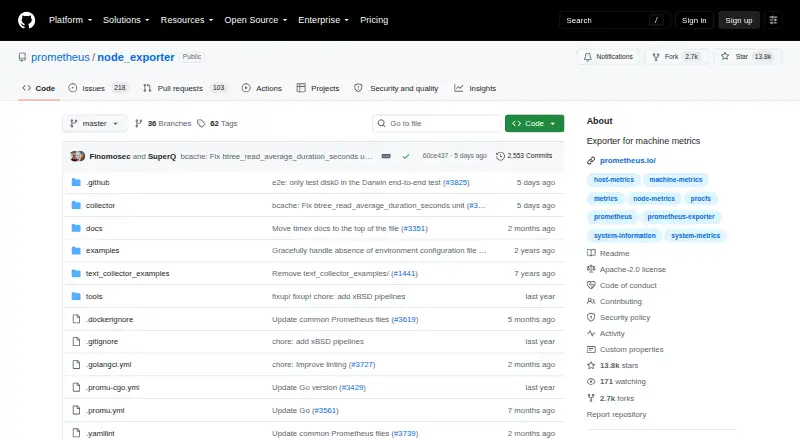
Prometheus Node Exporter is a self-hosted exporter that exposes hardware and operating-system metrics in Prometheus format. It is designed for teams monitoring Linux and other supported *NIX environments, including macOS, with Prometheus handling the scrape process. The exporter serves metrics over HTTP on port 9100 by default and covers CPU, memory, filesystem, disk, network, thermal, sensor, kernel, and other machine data. Pluggable collectors, collector flags, a textfile collector, Docker deployment, and an experimental TLS endpoint configuration support different infrastructure setups.
The pricing model is open source, with no paid plan structure described. The available distribution provides the exporter and its listed capabilities rather than separating features into subscription tiers. Its core scope includes Prometheus-format metrics, the HTTP endpoint, pluggable collectors, custom machine-tied metrics through the textfile collector, and Docker deployment with host filesystem and namespace access. Prometheus, Docker, and Ansible are listed integrations. Because it is self-hosted, the operating model centers on deploying and configuring the exporter within the environment where machine metrics are collected.
Node Exporter is an exporter component, not a complete monitoring console. Prometheus or another surrounding system provides retention, alerting, device limits, and notification channels. That makes it a focused choice for Prometheus-based hardware and operating-system metrics, but a less suitable fit for teams seeking built-in dashboards, alert management, or notifications in one product. Choose an alternative when the priority is an all-in-one monitoring interface or when operating a separate Prometheus-based monitoring stack is not appropriate.
Your product? Our editors can test Prometheus Node Exporter in depth and publish a review, labelled as paid · from $149/mo →
Prometheus Node Exporter pricing
Prometheus Node Exporter fact sheet
| Free plan | Not verified |
|---|---|
| Paid from | Free |
| Supported platforms | linux, macos, self_hosted |
| Remote monitoring | Yes |
| Monitored device limit | Not verified |
| Sensor history | Not verified |
| Alert channels | Not verified |
| Custom sensor support | Not verified |
| Pricing | Open source |
| Website | github.com |
| Facts checked | 19 Sep 2026 |
Alternatives to Prometheus Node Exporter
- GlassmkrFree monitoring for Linux hardware, with hosted simplicity or self-hosted control.9.3
- Supermicro SuperDoctor 5A free, focused monitor for Supermicro server health, alerts, logs, and remote power control.9.2
- HWiNFOA deep Windows diagnostics suite for users who need detailed sensors, reports, and alerts.9.1

See all Prometheus Node Exporter alternatives →
Used Prometheus Node Exporter? Be the first to review it
The editor score above is our own research. What this page doesn't have yet is a reader's view — what you used Prometheus Node Exporter for, what worked and what didn't. No stars are seeded and no review is paid for; an editor reads every one before it appears.
Write a reviewTwo minutes · verified accounts only · read by an editor before it appears
Featured on iTechGuides

Prometheus Node Exporter is listed in our Hardware Monitoring Software directory. Add the badge to your site — it links back to this page.
<a href="https://www.itechguides.com/products/prometheus-node-exporter/"><img src="https://www.itechguides.com/best/badge/prometheus-node-exporter.svg" alt="Featured on iTechGuides" width="230" height="46"></a>
Reviewed by iTechGuides Editors · Editorial team · Updated Sep 2026
Advertiser disclosure: iTechGuides is reader-supported. Vendors can pay for top positions in our rankings and for a place on other products' pages, and we may earn a commission when you click some links. Bought places stand at the number bought; this page and our disclosure say so. Paying vendors may get a fuller, more detailed review from our editors, and that review can change their score. How we rank.
Last updated · How we research and update