Pingouin
Pingouin: A focused Python library for common statistical tests, models, and effect-size work. Ranked #26 of 106 in Statistical Analysis Software by our editors (6.9/10); pricing: Open source; best for python users needing focused statistical routines.
At a glance
- Editor score6.9 / 10
- PricingOpen source
- Best forPython users needing focused statistical routines
- Paid fromFree
- Facts checked23 Sep 2026
Where it wins
- Broad coverage of ANOVA, correlations, regression, mediation, and Bayes factors
- Effect sizes, confidence intervals, and power calculations accompany tests
- Plotting helpers and tabular outputs fit Pandas-based research workflows
Where it doesn't
- A Python library rather than a hosted statistical application
- Requires local installation and a Python, IPython, or Jupyter workflow
- Narrower scope than a complete analysis suite with a graphical interface
Our verdict on Pingouin
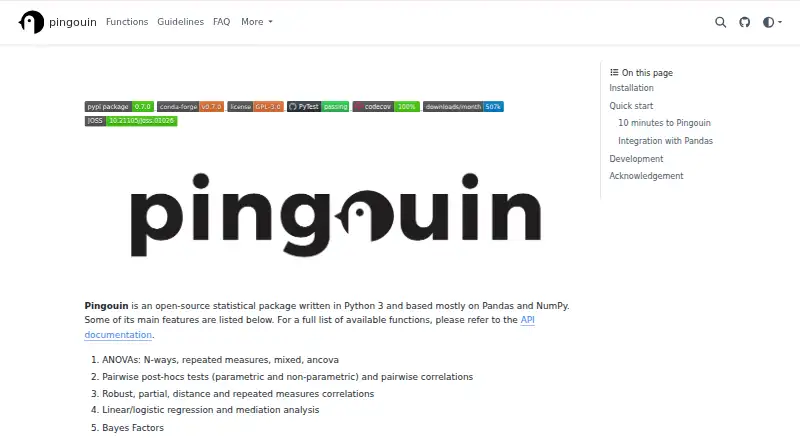
Pingouin is an open-source statistical package for Python 3, built around Pandas and NumPy. It is intended for researchers and Python users who want higher-level statistical procedures with tabular outputs inside Python, IPython, or Jupyter. Solo practitioners, research teams, and organizations that self-host Python tools can use it for hypothesis testing, modeling, effect-size work, and reporting support.
Its main strength is the range of procedures available in one library. Pingouin covers N-way, repeated-measures, mixed, and ANCOVA procedures; parametric and non-parametric pairwise post-hoc tests; several correlation methods; linear and binary logistic regression; mediation analysis with bootstrap methods; and Bayes-factor calculations for binomial tests, t-tests, and Pearson correlation. Effect-size, confidence-interval, and statistical-power calculations extend the analysis beyond significance testing. Circular statistics, chi-squared tests, reliability measures, multivariate tests, and plotting helpers such as Bland–Altman, Q-Q, and paired plots add useful supporting depth.
Pingouin fits teams that already work in Python and want focused statistical routines rather than a separate desktop or hosted environment. Installation is local through pip, uv, or conda, with community and documentation support. Data workflows can use CSV and XLSX files through Pandas, while scripting support makes repeated analyses practical. The tradeoff is scope and delivery model: Pingouin is a library, not an end-to-end analysis suite with its own hosted workspace or graphical interface. Choose it when Python integration and statistical breadth matter most; consider another product when you need a standalone application, managed deployment, or a broader visual analytics environment.
Your product? Our editors can test Pingouin in depth and publish a review, labelled as paid · from $149/mo →
Pingouin pricing
Pingouin fact sheet
| Free plan | Not verified |
|---|---|
| Paid from | Free |
| Deployment | Not verified |
| Statistical tests | Yes |
| Regression models | Yes |
| Scripting support | Yes |
| Bayesian analysis | Yes |
| Data import formats | .csv, .xlsx via Pandas |
| Deployment | Self-hosted |
| Support | Community, Docs |
| Built for | Solo, Small business, Mid-market, Enterprise (editorial estimate) |
| Pricing | Open source |
| Website | pingouin-stats.org |
| Facts checked | 23 Sep 2026 |
Alternatives to Pingouin
- RA free, programmable environment for statistical analysis, modeling, visualization, and data import.9.4
- StataA broad, scriptable desktop environment for professional and reproducible applied analysis.9.3
- IBM SPSS StatisticsA broad desktop statistics suite with testing, modeling, forecasting, reporting, and R/Python integration.9.2


See all Pingouin alternatives →
Used Pingouin? Be the first to review it
The editor score above is our own research. What this page doesn't have yet is a reader's view — what you used Pingouin for, what worked and what didn't. No stars are seeded and no review is paid for; an editor reads every one before it appears.
Write a reviewTwo minutes · verified accounts only · read by an editor before it appears
Featured on iTechGuides

Pingouin is listed in our Statistical Analysis Software directory. Add the badge to your site — it links back to this page.
<a href="https://www.itechguides.com/products/pingouin/"><img src="https://www.itechguides.com/best/badge/pingouin.svg" alt="Featured on iTechGuides" width="230" height="46"></a>
Reviewed by iTechGuides Editors · Editorial team · Updated Oct 2026
Advertiser disclosure: iTechGuides is reader-supported. Vendors can pay for top positions in our rankings and for a place on other products' pages, and we may earn a commission when you click some links. Bought places stand at the number bought; this page and our disclosure say so. Paying vendors may get a fuller, more detailed review from our editors, and that review can change their score. How we rank.
Last updated · How we research and update