
What’s actually slowing this PC down?
Pick the symptom - the matching free tool is one click away.
Grafana is an observability platform that connects to metrics, logs, traces, and other data, then presents query results in dashboards. You can run it yourself on a supported operating system or use Grafana Cloud. A practical first path is to start with Grafana’s built-in data source, learn the panel workflow, and then connect the system data you actually need to monitor.
Choose self-hosted Grafana or Grafana Cloud
The two main deployment choices differ primarily in who operates the Grafana instance.
| Option | What you do | Best fit |
|---|---|---|
| Self-hosted Grafana | Install Grafana, manage its configuration and database, apply updates, and operate availability and security. | Teams that need control over deployment, networking, data locality, or custom operations. |
| Grafana Cloud | Use Grafana’s hosted service instead of installing and maintaining the Grafana server yourself. Cloud also documents packaged integrations for supported systems. | Readers who want to avoid server maintenance and prefer a managed starting point. |
This material does not establish a complete price, feature, or service-limit comparison. Check Grafana’s current official plans when those details affect your decision.
Install Grafana on a supported platform
Grafana’s installation documentation lists Debian or Ubuntu, RHEL or Fedora, SUSE or openSUSE, macOS, and Windows as supported operating-system families. Follow the current instructions for your specific distribution and Grafana release rather than copying commands intended for another platform.
#1 Best Overall

- Extensive Compatibility - Forhelp portable monitor features 2 full-featured Type-C ports and 1 MINI HDMI port. You can easily access your favorite devices with just one USB Type-C or MINI HDMI cable. NOTE: Your device should support Thunderbolt 3.0/4.0 or USB 3.1 Type C DP ALT-MODE. It is compatible with all devices equipped with HDMI and USB Type-C ports like laptops, PS, XBOX, SWITCH game consoles.
- Full HD Portable Monitor - 15.6inch portable laptop monitor with 1920*1080 resolution, advanced IPS Matte screen support 178° full viewing angle, it renders accurate and bright color, draws you into the video or game with lifelike colors and amazing detail. It can effectively reduce blue light radiation damage, no flickering, eye-care, and make it easier to watch for a long time.
- Ultra-slim Portable Monitor - As a portable external monitor, Forhelp portable laptop monitor's body is made of aluminum alloy, the weight of the whole machine is 1.52lb, 0.3" ultra-thin profile, can easily fit into your bag, so you can carry it with you. With our magnetic smart holster, you can use and store it anytime.
- Able to Balance Work and Play - With multiple display modes [copy mode/extension mode/second screen mode]. During meetings,it can copy your laptop's content as a second screen to share with others. At work, it can be used as a second extended screen to increase productivity. In life, adjusting to HDR mode can upgrade the image to a new level, providing you with brighter highlights, more realistic colors and images. Two built-in speakers provide an amazing viewing and gaming experience.
- DURABLE SMART COVER - Comes with a scratch-proof smart cover made of durable PU leather exterior, doubles as a stand, provides comprehensive protection for this portable computer monitor. There are two grooves in the cover base to give at least some choice of viewing angle for your comfort.
Minimum resources are only a starting point
Grafana lists a minimum recommendation of 512 MB of memory and one CPU core. This is a baseline for the Grafana application, not a promise that a production deployment will handle your workload. Query complexity, dashboard panel count, refresh intervals, alert rules, concurrent users, and data-source behavior can all increase demand.
Capacity planning must also include the systems Grafana queries. Sizing a Grafana server does not size Prometheus, Mimir, Loki, Tempo, a SQL database, or another backing store. Those systems need their own storage, memory, CPU, retention, and availability plans.
Self-hosted installation checklist
- Choose a supported operating system and follow the matching current installation guide.
- Decide whether the instance is for local learning, a small evaluation, or production.
- Plan persistent storage for Grafana’s configuration database and backups.
- Plan network access to the data sources Grafana will query.
- Protect the web interface, administrator account, and any credentials used by data sources.
- Record the Grafana version and deployment settings so upgrades can be repeated safely.
Understand Grafana’s two kinds of data storage
A frequent source of confusion is treating Grafana’s configuration database as the place where monitoring data lives. They serve different purposes.
Grafana’s configuration database
Grafana requires a database for configuration items such as users, data sources, and dashboards. New installations use embedded SQLite. Grafana describes SQLite as suitable for local development and small evaluation instances, but not recommended for production. High availability requires MySQL or PostgreSQL.
Do these 3 things before closing this tab:
1Clear out junk files and repair common Windows errors2Scan for outdated or missing drivers - takes under a minute3Repair Windows errors before they cause bigger problems| Configuration database | Documented status | Typical implication |
|---|---|---|
| SQLite | Default for new installations; useful for local development and small evaluations; not recommended for production. | Simple to start, but not the production choice for a highly available deployment. |
| MySQL | Supported at version 8.0 or later. | Use when your operational design calls for an external relational database. |
| PostgreSQL | Supported at version 12 or later. | Another supported external relational-database option, including for high-availability designs. |
Visualization data sources
A data source is the connection to a database, monitoring system, service, or other location that stores metrics, logs, traces, or related data. Grafana sends queries to that source when a panel loads or refreshes. Prometheus, Loki, MySQL, and CloudWatch are examples documented in Grafana’s beginner material.
Rank #2
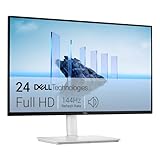
- Elevated entertainment: The FHD resolution and 1500:1 contrast ratio bring clarity, while a 144Hz refresh rate, and 1ms Moving Picture Response Time (MPRT) deliver a smooth, tear-free viewing experience.
- Hear the audio difference: Immerse yourself in sound with integrated dual 3W speakers delivering a wider range of frequencies.
- Eye comfort: Prioritize visual comfort with this 4-star TÜV-certified display. Reduce harmful blue light emissions while maintaining stunning image quality without compromising colors.
- Designed for comfort: Adjust your monitor to suit your preference throughout the day.
- Dell Display and Peripheral Manager: Experience Dell’s singular, innovative application to optimize the performance of your entire Dell PC workspace*. *Based on Dell internal analysis, December 2024.
Your configuration database stores Grafana’s own objects; a visualization data source stores the information those objects query. Installing Grafana does not automatically collect your application or infrastructure telemetry.
Configure Grafana
Grafana configuration can be expressed through configuration files and environment variables. The exact settings depend on your deployment and the behavior you need to change, such as the HTTP listener, authentication, database connection, or external URLs.
Manual configuration versus provisioning
Manual setup is practical for a single learning instance: sign in, add a data source, and create dashboards through the user interface. Provisioning is the automation-oriented approach when you need repeatable setup or many dashboards. It lets an operator define resources as deployment configuration instead of recreating them by hand. Use the current provisioning documentation for the resource types and settings supported by your Grafana version.
Initial access
Grafana’s beginner workflow uses the local instance’s web interface. The default HTTP port is 3000. Change the default administrator password during the first sign-in, and place the service behind the access controls appropriate for your environment before exposing it beyond a trusted network.
Build a first dashboard with the documented practice workflow
You can learn the dashboard process before connecting a production data system. Grafana includes a built-in data source named -- Grafana -- that can generate practice data.
Rank #3

- Full HD Portable Monitor - MNN 15.6inch portable laptop monitor with 1920*1080 resolution, advanced IPS glossy screen support 178° full viewing angle, it renders accurate and bright color, draws you into the video or game with lifelike colors and amazing detail.It can effectively reduce blue light radiation damage, no flickering, eye-care, and make it easier to watch for a long time.A second monitor for working from home.
- Double Type-C Port -For Plug & Play, the MNN monitor provides 2 Full Feature Type-C ports. Only One USB Type-C Cable is required to connect to the power supply & display signal transmission. NOTE: Your device should support thunderbolt 3.0 or USB 3.1 Type C DP ALT-MODE.which supports multiple connect ways to your laptops, PC, Phones, Macbooks, PS5/PS4, Xbox, and Switch.
- Lightweight Ultra Slim for Travel - As a portable external monitor,MNN portable laptop monitor easily accommodate to every suitcase and backpack and stress-free when you are holding it for a long time. They are truly portable computer monitors for travelers, students, gamers,engineers, and everyone.
- Give consideration to work and games - through multiple display modes [Copy Mode/Extended Mode/Second Screen Mode/Portrait Mode], we can bring you a clear second screen in the meeting, and expand the screen anytime and anywhere to improve work efficiency and improve the quality of life. Adjusting to HDR mode can upgrade the image to a new level, providing you with brighter highlights,deeper and more realistic colors, more realistic images, and amazing viewing/gaming experience.
- Powerful Smart Cover - MNN portable external monitor can work in both landscape and portrait mode, can be used as a gaming monitor, screen extender for laptop or phone. Comes with a scratch-proof smart cover made of durable PU leather exterior, doubles as a stand, provides comprehensive protection for this portable computer monitor.
- Open the Grafana instance in a browser and sign in.
- Create a new dashboard.
- Add a panel.
- Choose a visualization and use the
-- Grafana --data source. - Run the example query that produces the Random Walk practice data.
- Save the panel and dashboard after confirming that the visualization renders.
The built-in source is a learning aid. It does not replace a connection to the metrics, logs, traces, or business data you intend to monitor.
How dashboards, panels, queries, and transformations fit together
Dashboards
Grafana Labs defines a dashboard as “a set of one or more panels that provide an at-a-glance view of related information.” A dashboard groups related views so a user can inspect a service, team, environment, or operational question in one place.
Recommended Free Tools
Panels
A panel is the working unit inside a dashboard. It queries a selected data source, optionally transforms the returned data, and displays the result using a visualization. A dashboard can contain one panel or many panels.
Queries
The query language and editor depend on the selected data source. A Prometheus query, a Loki log query, a SQL statement, and a CloudWatch request have different syntax and return different shapes. Start with the question you want answered, then write or select a query that returns the fields and time range needed by the panel.
Transformations
A transformation manipulates data returned by a query when the raw result is not shaped appropriately for the chosen visualization. Transformations can help rename, calculate, join, filter, or reorganize fields. They do not collect new telemetry; they alter the data available to the panel after the query runs.
Rank #4
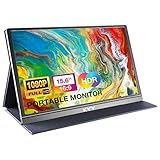
- [ FHD 1080P PORTABLE MONITOR ]: KYY using a 15.6''(8.8"x14.2") advanced IPS screen with 178° wide viewing angle, Delivers 1920*1080 breathtaking viewing quality and HDR technology, KYY portable gaming monitor has excellent color rendering ability, provide you the clearer, smooth, excellent performance in gaming/multimedia. It can effectively reduce blue light radiation damage, no flickering, eye-care, and make it easier to watch for a long time
- [ WIDE COMPATIBILITY ]: KYY portable monitor for laptop equipped with 2 Full Function Type-C ports and Mini-HDMI port, easy access to your favorite devices with 1 cable solution as long as your device support Thunderbolt 3 or 3.1 USB-Type-C, compatible with most laptop, smartphone, PC, PS4, XBOX and more.
- [ ULTRA-SLIM PORTABLE DISPLAY ]: KYY USB C portable monitor features a 0.3inch ultra-slim profile(1.7lb), it is easy to slides into your bag, allows you to carry it everywhere, ideal for a simple on-the-go dual-monitor setup or extend your phone screen for movies or games. No driver needed and equipped with 3.5mm audio inputs and 2 built-in stereo speakers to enhance entertainment experience
- [ DURABLE SMART COVER ]: Comes with a scratch-proof smart cover made of durable PU leather exterior, doubles as a stand, provides comprehensive protection and frameless magnetic design for this portable computer monitor. There are two grooves in the cover base to give at least some choice of viewing angle for your comfort for less cumbersome installation
- [ LIGHTWEIGHT BUT POWERFUL ]: KYY portable external monitor can work in both landscape and portrait mode, can be used as a gaming monitor, screen extender for laptop or phone. It has a unique designed Premium gray metal appearance, 2 built-in speakers to play audio, a friendly menu control wheel for setting, and 24/7 professional support team
Choose a visualization for the data shape
Use a time-series visualization for values changing over time, a table for individual records or detailed fields, and a stat-style display for a single current value or summary. The right choice depends on both the operational question and the structure of the query result. A visually attractive chart is not useful if it obscures the unit, time range, label, or aggregation that gives the value meaning.
Crashes, No Sound, or Screen Glitches?
Random freezes, missing sound and display glitches usually trace back to one bad driver. Find and replace yours safely.Free scan · under a minutePC Slower Than It Used to Be?
A free scan shows the junk files, broken settings and background clutter dragging Windows down - then fixes them in one click.Free scan · Windows 10 & 11Add a real data source
After practicing with the built-in source, add the system that contains your real data. In the Grafana interface, create a data-source connection, supply the endpoint and authentication details required by that system, save the configuration, and use its query editor in a panel. Keep credentials scoped to the minimum access needed, and verify network reachability from the Grafana server rather than only from your workstation.
Standalone data-source configuration
Configuring a source yourself is the flexible option for custom environments, unusual schemas, and dashboards tailored to a particular system. You choose the endpoint, credentials, queries, transformations, and panel design.
Grafana Cloud integrations
A Grafana Cloud integration is a packaged onboarding path for a supported use case. It can include collection instructions, configuration, dashboards, and alert or recording rules. That is different from adding a standalone data source: an integration bundles more of the setup, while a standalone connection leaves the dashboard and collection design in your hands.
Grafana’s visualization documentation lists more than 150 data-source plugins (Grafana Labs, documentation consulted September 27, 2026). The count describes available data-source plugins, not market share or adoption.
Best Value

- 15.6" FHD Portable Monitor - Featuring a 1920*1080P resolution, 178°FULL viewing angle, HDR, and Low Blue Light Super Clear IPS A-grade screen, this WGK portable screen for laptop enhanced visual experience, reduces eye strain and fatigue.
- Easy-use dual Type-C ports-plug and play. Portable displays come with 2 USB-C ports and 1 Mini HDMI port, and if your device has a Thunderbolt 3/4 or full-featured USB-C port, all you need is a USB-C to USB-C cable.
- Monitor with built-in stand - Weighs only 2.7 pounds, so it's easier to carry. Portable gaming monitor with built-in stand is easy to adjust to your favorite viewing angle. Two built-in speakers provide an amazing viewing and gaming experience.VESA Mountable
- Multiple Display Modes - Copy Mode/Extended Mode/Second Screen Mode. During meetings, it can copy the content of your laptop and share it with others as a second screen; at work, it can be used as a second extended screen to improve work efficiency. In life, adjusting to HDR mode takes images to the next level, and you can switch screen views between horizontal and vertical modes Low blue light technology ensures a comfortable viewing experience
- Wide range of compatibility - Enjoy hassle-free plug-and-play functionality with the portable monitor. it is compatible with all devices equipped with HDMI and USB Type-C ports like laptops, PS, XBOX, SWITCH game consoles, No app or driver installation required.
Plan dashboard performance and reliability
Every panel refresh can generate work against its data source. More panels and shorter refresh intervals generally increase query throughput, especially when many users open the same dashboard. Workload also depends on query range, aggregation, alert evaluations, transformations, and the behavior of the backing system.
- Prefer queries that retrieve only the time range, labels, and fields the panel needs.
- Avoid setting an unnecessarily short refresh interval for slow-changing information.
- Watch the effect of adding panels to a dashboard used by many concurrent viewers.
- Monitor the data source as well as Grafana; a healthy Grafana process cannot compensate for an overloaded telemetry store.
- Use an external MySQL or PostgreSQL configuration database when your availability requirements rule out SQLite.
- Back up dashboards, data-source definitions, users, and the configuration database according to your recovery objectives.
Grafana’s published workload guidance uses dimensions such as concurrent users, alert rules, data sources, and dashboards. Treat those dimensions as planning inputs, not as a universal capacity guarantee: actual load depends on your queries and refresh patterns.
Common first-run problems
The practice dashboard works, but real panels are empty
The built-in -- Grafana -- source generates sample data only. Configure and test the external source that contains your telemetry, then select it in the panel query.
A panel shows an error or times out
Check connectivity from the Grafana host, credentials and permissions, the query’s time range, and the data source’s own health and limits. A timeout can originate in the backing store rather than in the panel’s visualization.
The Tool Desk
Outbyte Driver Updater FREEFix the driver behind crashes, sound loss and screen glitchesFind Drivers →Outbyte PC Repair FREERepair Windows errors before they cause bigger problemsFix Now →The dashboard is slow after adding panels
Inspect panel queries and refresh intervals, reduce unnecessary panels or time ranges, and check concurrent use. Then examine resource pressure and query latency in the backing data system.
Multiple Grafana instances do not share state correctly
Review the configuration-database design. SQLite is not Grafana’s recommended production option and does not provide the high-availability arrangement documented for MySQL or PostgreSQL.
Quick Recap
Product prices and availability are accurate as of the date/time indicated and are subject to change. Any price and availability information displayed on Amazon at the time of purchase will apply.

