
The Tool Desk
Outbyte PC Repair FREERepair Windows errors before they cause bigger problemsFix Now →Outbyte Driver Updater FREEScan for outdated or missing drivers - takes under a minuteDriver Scan →A useful incident ticket lets responders see the impact, current status, owner, timeline, diagnostic evidence, and repair actions without piecing them together from scattered notes. Set up a consistent template, attach or link a bounded and interpretable log excerpt, and record what each repair changed and whether it worked.
What an incident ticket should capture
Use one template for incidents, then adapt its fields to your organization’s response process and ticketing system. Keep the first screen focused on what a responder needs immediately; put detailed evidence and analysis in clearly labeled sections below.
| Section | Record |
|---|---|
| Summary and classification | A concise statement of the incident; severity and why it was assigned; affected service, environment, host, or component; current status; ticket owner; and incident lead. |
| Impact | User-visible symptoms, affected customer or system scope, when impact began and ended if known, and how scope or impact was estimated. Label estimates as estimates. |
| Detection and timeline | Detection source and time, first alert or report, response start, important decisions and communications, mitigation attempts, recovery, and verification. |
| Technical evidence | Links to relevant alerts, dashboards, traces, deployment or change records, and related tickets, plus a log link or bounded excerpt with the metadata needed to interpret it. |
| Repair context | What action was taken, why, by whom or which role, when, what result was observed, and whether the change was rolled back or remains in place. |
| Cause and follow-up | Confirmed causes and contributing conditions as they become known, clearly separated from hypotheses, plus lessons and assigned, trackable corrective actions. |
Atlassian recommends capturing impact, mitigation or resolution, root cause, and preventive actions in postmortems, and using consistent prompts with useful detail. Its incident response guidance says it tracks impact-start, detection, and impact-end times in Jira custom fields. Atlassian’s postmortem guidance and incident response page describe these practices.
How to attach or link server logs
A log excerpt is evidence, not an explanation by itself. Make it possible for another responder to identify where it came from, what period it covers, and how it informed the response.
#1 Best Overall
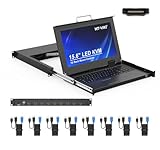
- MT-VIKI 1568HL is all-in-one console to manage up to 8 computers. Features a 15.6" LCD monitor with 1920x1080@60Hz resolution. Combines monitor, keyboard, and touchpad into a single 1U rackmount drawer to save up to 85% of valuable cabinet space.
- Adjustable Depth & 2 set Rack Rails: Includes two sets of Rack Rails. Short Rack Rails: Fit 18.9"–23.6" (480-600mm) deep network racks (Note: check cable clearance for depths under 600mm). Long Rack Rails: Fit 23.6"–31.5" (600-800mm) deep standard racks. Measure your rack depth before purchase to ensure a perfect fit.
- External Monitor Support & Flexible Operation--Features an HDMI console output for connecting an external monitor, allowing convenient server access without opening the rack. Three Ways Switching: Support OSD menu, Hot-key or push button switching.This 8 port lcd kvm console provides 2-level password security (administrator and user), up to 8 authorized users and an administrator view and control the computers
- Lightweight Aluminum & Steel Build: Upgraded with an aluminum interior for less weight and a rugged steel drawer shell for industrial durability. Features a built-in handle and lock for secure operation. Physical Dimensions: 18.9" x 23.6" x 1.77" (480mm x 600mm x 45mm).
- Built for Professional Environments – Ideal for server rooms, data centers, industrial control systems, and security monitoring centers where multiple computers need centralized management or when technicians need direct access to connected systems without an external monitor.
- Choose the relevant source. Identify the host or service and the log source, then link to the approved diagnostic view or attach a bounded excerpt.
- Define the time window. State the start and end times and timezone. Prefer explicit UTC timestamps for distributed teams, and preserve the original timestamps when importing logs.
- Describe how it was collected. Include the collection command or query and any filtering applied so readers can understand what the excerpt includes and omits.
- Keep interpretive context. Include enough surrounding entries to make the excerpt understandable, rather than pasting a single unexplained line.
- Connect evidence to the incident. Explain which symptom or timeline event the log supports and, where relevant, which repair action it helped inform. Link related alerts, dashboards, traces, or change records.
- Respect local data-handling rules. Follow your organization’s security and data policies. Use approved, appropriately restricted storage or links when raw logs should not be copied into a general ticket.
There is no single redaction, retention, access-control, or attachment-size rule established for every organization. Apply the policies that govern your logs rather than assuming that a general ticket is an appropriate place for raw diagnostic data.
Build a timeline that can be reconstructed
Write important events in time order, with an explicit timestamp and timezone for each. Distinguish observations from interpretation: “5xx rate rose after deployment” is an observation if supported by monitoring; “the deployment caused the incident” is a causal conclusion that should remain a hypothesis until established.
Rank #2

- Lightweight, 11.43 lbs./Toolless installation. (single person)
- Front access 2 USB 3.0 pass-through ports for media devices.
- Short-depth (17.05in.) Rack Console includes 17.3" LCD, 104 Keyboard/Touchpad.
- 3 Button Touchpad supports Linux. World Wide / TAA compliant.
- Made in USA
Include the detection source, first report or alert, response start, consequential decisions, communications, mitigation attempts, recovery, and verification. Atlassian’s incident postmortem guidance also emphasizes tracking the incident’s impact start, detection, and impact end. Its guide to creating postmortem reports and incident postmortem process guide provide further context for recording and reviewing incidents.
Record repair actions as events, not just conclusions
For each significant repair or mitigation, document the action, its rationale, the responsible person or role, when it occurred, the observed result, and its disposition. A rollback, restart, configuration change, traffic shift, or other intervention should be legible in the timeline alongside the evidence that prompted it.
Recommended Free Tools
Rank #3

- Fits Small & Standard Racks (480–800mm Depth): 8 port USB HDMI LCD KVM console, Designed for compact server cabinets 480-600mm, but adjustable for max 800 depth (2 extended rails included) support 1920x1080@60Hz, compatible with Windows/Dos, Linux, Mac OS8.6/9/10. perfect for edge cabinets and space-limited environments.
- All-in-One 1U Rack Console Design: Combines a 15.6" LCD monitor, full keyboard, and touchpad into a single 1U sliding drawer, saving valuable rack space in server rooms and data centers. Support Daisy Chain/Cascade up to 64 servers, OSD menu, hotkey & button switch. 8-pack pro KVM cables included.
- Smooth Sliding Rail & Space Saving: Slide-out drawer design allows easy access when needed and neatly folds back into the rack when not in use, keeping your setup clean and organized.
- Ideal for Server Rooms & Network Cabinets: Perfect for data centers, IT rooms, AV racks, and industrial control systems where reliable local access is required. CE, ROHS, REACH, PSE certified with tech support. please check the Datasheet below.
- Package inside: 15.6 inch LCD KVM Console*1, KVM Cable *8(5 ft x 4, 6 ft x 4), Power Adapter and Cable *1, User Manual *1. Longer KVM cables, pls refer to ASIN: B09BCVL9B4/B09BCWLXH7.
- Separate confirmed cause from working hypotheses, and label uncertainty explicitly.
- Record whether the action restored service, reduced impact, had no clear effect, or introduced another issue.
- State whether the change remains in place or was reversed.
- Verify recovery against the user-visible symptom or relevant service indicators; record what was checked and when.
Keep the wording blameless and focused on systems, conditions, decisions, and outcomes. The purpose is to understand what happened and reduce recurrence or impact, not to assign personal fault. Atlassian’s Incident Management Handbook describes post-incident documentation, learning, and follow-up as part of incident management.
Independent reader supportYour contribution helps us test, update, and keep practical guides available for everyone.Turn findings into owned follow-up work
When the cause is better understood, add contributing conditions and root causes without rewriting earlier observations as though they were known at the time. Convert lessons into separate follow-up items that can be assigned and tracked; “investigate later” is not enough to show who will do what.
Rank #4

- High-Resolution Touch Display – Features a 6.91 inch LCD with 1424x280 resolution, delivering sharp visuals and responsive touch control for efficient server management. NOTE: There will be a protective film on the screen surface. Please remove it before use.
- 10 inch 1U Rack-Mountable Design – Compact and space-saving, this monitor fits seamlessly into 10inch server racks, making it ideal for data centers and network cabinets.
- Compatible with DeskPi RackMate Series – Specifically designed for DeskPi RackMate T0/T1/T2/T0 Plus/T1 Plus/TL1/T1/2 Plus Server Cabinet and Standard 10 inch Server Rack, ensuring perfect integration and ease of installation.
- User-Friendly Touch Interface – The capacitive touchscreen allows for intuitive operation, reducing reliance on external input devices.
- Durable & Efficient for Server Use – This monitor offers reliable performance in server environments with low power consumption and robust construction.
- Describe the corrective action in concrete terms.
- Assign an owner and link the work item or ticket.
- Keep the follow-up status visible and connect it to the incident record.
Consistent incident records make later reference and pattern discovery more useful, while tracked corrective work gives the review a path to reducing future impact. The specific fields and workflow can vary by organization; the essential outcome is a readable record that connects impact, evidence, decisions, repairs, and follow-through.
Quick Recap
Best Value

- Fits Small & Standard Racks (480–800mm Depth): 8 port USB VGA LCD KVM console, Designed for compact server cabinets 480-600mm, but adjustable for max 800 depth (2 extended rails included) support 1920x1080@60Hz, compatible with Windows/Dos, Linux, Mac OS8.6/9/10. perfect for edge cabinets and space-limited environments.
- All-in-One 1U Rack Console Design: Combines a 15.6" LCD monitor, full keyboard, and touchpad into a single 1U sliding drawer, saving valuable rack space in server rooms and data centers. Support Daisy Chain/Cascade up to 64 servers, OSD menu, hotkey & button switch. 8-pack pro KVM cables included.
- Smooth Sliding Rail & Space Saving: Slide-out drawer design allows easy access when needed and neatly folds back into the rack when not in use, keeping your setup clean and organized.
- Ideal for Server Rooms & Network Cabinets: Perfect for data centers, IT rooms, AV racks, and industrial control systems where reliable local access is required. CE, ROHS, REACH, PSE certified with tech support. please check the Datasheet below.
- Packing List: 1x 15.6'' LCD KVM, 8x VGA KVM cables, 2x rail set, 1x Power adapter, 1x User manual.
Product prices and availability are accurate as of the date/time indicated and are subject to change. Any price and availability information displayed on Amazon at the time of purchase will apply.
Quick wins for a faster PC:
Clear out junk files and repair common Windows errorsFree Scan →Fix the driver behind crashes, sound loss and screen glitchesFind Drivers →Repair Windows errors before they cause bigger problemsFix Now →
