
Quick wins for a faster PC:
Fix the driver behind crashes, sound loss and screen glitchesFind Drivers →Repair Windows errors before they cause bigger problemsFix Now →There is no universally best cloud region. First rule out locations that fail residency, service, capacity, or resilience requirements; then compare the full cost of the deployment, measure latency from the users and systems that matter, and assess water risk in the local watershed. Provider tools can narrow the options, but none of the available figures alone gives a complete, directly comparable answer.
Start with regions your workload is allowed and able to use
Make a feasible list before comparing price or environmental indicators. A region is not a viable candidate if it cannot meet a legal or operational requirement, even if it looks attractive on another measure.
Check residency, services, and capacity
- Write down the jurisdictions and data-residency or sovereignty rules that apply. Verify the requirements for each service you plan to use; a region name by itself does not establish where every service stores or processes data.
- Confirm that the required services, machine types, accelerators, quotas, and capacity are available in the candidate region. Product availability varies by region and changes over time; a newly launched region may not offer every product. Google Cloud maintains a current location and product availability overview.
- Identify user locations and dependencies such as databases, offices, on-premises systems, and other services. A region close to users may still be a poor choice if a critical dependency is far away.
Regional service availability, pricing, transfer charges, and deployment trade-offs are covered in Google Cloud’s Compute Engine region-selection guidance. Treat region selection as an architecture decision: moving a live workload later can be costly or cumbersome.
Decide how much redundancy the workload needs
Define recovery objectives and failure-domain requirements before estimating cost. A design that spans zones or regions can change both the feasible set and the bill; cross-region synchronization, for example, can add data-transfer charges. Compare architectures that provide the same resilience rather than comparing a single-region design in one place with a redundant design in another.
#1 Best Overall

- Accurate and Reliable TDS Meter: Equipped with a premium quality titanium alloy probe, our TDS meter, Electric Conductivity Meter, digital water tester ensures stable performance and exceptional accuracy for reliable water quality testing. Ideal for testing drinking water, filter water, bottle purified water, RO filters, aquariums, and hydroponics.
- 3-in-1 Water Tester: Measures TDS, EC (conductivity) and water temperature in one reading. Perfect for drinking water, RO systems, aquariums and hydroponics.
- Easy-to-Read Backlit LCD Display: Features a large backlit screen for clear readings, even in low light conditions. The auto-lock function holds the reading for ease of use, making it an excellent tds water tester.
- Instant and Simple Operation: Just turn on the ppm water tester and dip it into the water for quick, accurate readings. Great for use as a digital TDS water tester or ppm meter.
- Customer Satisfaction Guaranteed: Includes a 3-year warranty and a 90-day money-back guarantee for complete peace of mind with your purchase. Trust our total dissolved solids (TDS) meter for all your water quality testing needs.
Estimate the cost of the deployment you will actually run
A generic compute price is a screening signal, not a production estimate. For each feasible region, price the same workload shape and resilience design, and record assumptions and the date of the estimate. Use current provider calculators or SKU data because regional prices and offerings can change.
Include the complete cost model
- Compute instance type, expected utilization, and any accelerators
- Storage volume, storage class, snapshots, and backups
- Managed services and load balancers
- Internet egress, inter-region traffic, and replication or synchronization
- Support, discounts, commitments, and other billing assumptions
- Redundant capacity required for availability and recovery objectives
Google’s Region Picker cost signal is based on generic compute instances, so it can help screen locations but does not price a complete workload. Its description of the Region Picker explains that limitation. Cross-region synchronization is another reason to include network charges in the estimate, not just instance and storage rates.
Rank #2

- 【Professional Water Quality Testing】TOC, COD, EC, UV275 & TDS, these laboratory-level values can reflect the degree of water pollution and are usually detectable only in laboratories. The DANOPLUS 6 in 1 water quality tester is not only suitable for laboratory use but also ideal for home, hiking, camping, travel, and emergency preparedness
- 【Easy to Read】The TDS meter features a water quality rating function, divided into 4 levels: fine, good, average, and poor, corresponding to blue, green, yellow, and red backlight colors respectively, making it extremely easy to assess water quality. Suitable for testing drinking water for household, family, and general wellness applications.
- 【Portable】Equipped with 2 AAA batteries(included), compact in size (5.9 inches * 1.57 inches), this water quality tester for drinking water is easy to carry, allowing for quick and accurate testing of the water quality of drinking, well, pond, and lake water
- 【Easy Calibration】No need for calibration powder. Simply place the drinking water tester in distilled or pure water, select the calibration button, and wait for 3 seconds to complete calibration. (Do not use mineral water or natural drinking water for calibration)
- 【Note】If the water tester for drinking water is used for experiments, it should be calibrated weekly; For daily home or outdoor travel use, calibration is not required weekly, calibration with distilled water is sufficient after a period of use
Measure latency along real user and dependency paths
Geographic proximity affects network travel time, but it does not equal end-to-end application latency. ISP routing and last-mile connections, edge routing, caching, load balancing, database round trips, and application processing all contribute to what users experience.
Test the sources and percentiles that matter
- Choose representative source locations: user populations, offices, and important upstream or downstream systems.
- Measure network round-trip time and application-level latency over realistic routes and under realistic load.
- Compare median latency and tail percentiles such as p95 or p99 with the workload’s own service-level objective.
- Separate network time from application processing and database round trips so a slow result points to the right part of the path.
Google’s region-selection guidance explains why region choice is only one part of latency optimization. A proximity tool can narrow the map, but it cannot replace testing the production route and application path.
Rank #3

- TDS Meter: The TDS meter digital water tester is equipped with a premium titanium alloy probe that can quickly and accurately test the total dissolved solids (TDS) of water. With the water quality tester, you can quickly test the TDS value to help you understand the turbidity of your household water and maintain the health of your drinking water.
- Portable Design: With just one TDS water tester, you can easily monitor multiple important parameters in the water, making it a great helper for home water quality testing. The water tester for drinking water has a large LCD display screen to help you clearly see the measurement values in any situation.
- Auto Calibration: The water tester for drinking water has an automatic calibration function that can adjust according to water temperature and water quality, completing the calibration in 1-3 seconds. The drinking water tester will automatically turn off after 5 minutes of inactivity to save power.
- Easy to Use and Portable: Simply turn on the water PPM tester, immerse the probe about 1 inch deep in the water, and the PPM water quality tester screen will display the TDS value in PPM in just a few seconds. The TDS tester is lightweight and portable, easily fitting in your pocket or bag for testing anywhere.
- Widely Applicable: This PPM meter can be widely used for various water quality tests, including drinking water, swimming pool water, tap water, and well water. The water purity tester can not only test the purity of the water, but also help you monitor when to replace the reverse osmosis filter, and can be used to check the TDS (total dissolved solids) of swimming pools and aquariums.
Assess water risk at the watershed, not from a global provider score
Water stress is local and can vary by season. Start with the watershed associated with the actual facility, or the best-supported geographic proxy available, and examine both baseline conditions and seasonal variation. WRI’s Aqueduct tools and Aqueduct data provide location-oriented water-risk indicators, including water stress and seasonal variability.
Build a local water-risk picture
- Check water stress, depletion, and seasonal variability, alongside drought or flood exposure and projected change where the data support it.
- Verify the watershed and time period represented by each indicator. A regional or watershed risk layer is not a measurement of a particular data center’s water consumption.
- Where possible, ask the provider for site- or region-level information: water source, cooling approach, reporting year and boundary, and separate figures for withdrawal and consumption, freshwater and reclaimed water.
- Keep local water risk distinct from the workload’s impact. A watershed indicator describes local conditions; a provider efficiency figure describes a differently scoped aspect of operations. Neither alone measures the total effect of a particular workload.
Read provider figures with their scope attached
Public company-wide figures can provide context about efficiency or sourcing, but they do not identify the local water impact of a particular cloud region. Facility ownership, climate, cooling design, reporting boundaries, and metric definitions vary, so the figures below should not be ranked as if they measured the same thing.
Rank #4
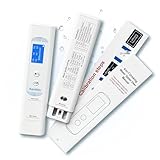
- Laboratory-grade Water Testing: COD and TOC refer to levels of organic pollutants and other harmful substances that can only be measured by specialized laboratories, and we've improved them into high-end testers for home, hiking, camping, travel, and more
- Compact and Easy to Carry: The drinking water tester, compact size, convenient to test the water quality of your home drinking water, well water, pond water, lake water and whether you need to change your outdoor water filter bottle cartridge at any time
- Simple Calibration: One button calibration, no need for tedious calibration powder, simply place it in puried or distilled water (no mineral or natural drinking water please, or calibration will fail), then select the calibration button and wait 3 seconds
- Calibrated for Different Situations: The probe is a laboratory grade spectroscopy probe, so the device is powered on with a prompt "calibrate within a week". Does not need to be calibrated as often for less stringent daily home use or outdoor travel use
- Water Quality Visualization: The color of the display will be divided into 4 grades of excellent, good, medium and poor water quality, allowing you to intuitively understand the quality of the sample water, to ensure that you drink safe and secure water
| Provider and figure | What it describes | What it does not establish |
|---|---|---|
| Microsoft: average WUE of 0.27 liters per kilowatt-hour in 2025 | Microsoft-reported average for its datacenters, reported in a June 24, 2026 blog post. Microsoft’s 2025 water-efficiency report provides the figure. | A water-use score for an individual cloud region or a matched comparison with another provider. |
| Amazon: WUE of 0.12 liters per kilowatt-hour in 2025 | Amazon-reported figure for its data-center operations, disclosed in June 2026. See Amazon’s data-center water disclosure. | A region-level water impact or a directly comparable result under another provider’s reporting boundary. |
| Google: 87% of freshwater withdrawal from sources at low or medium risk of water depletion or scarcity in 2025 | Google-reported aggregate sourcing statistic on its page reporting 2025 data. See Google’s data-center sustainability information. | A region-by-region comparison or a water-efficiency measurement equivalent to WUE. |
WUE and water replenishment or sourcing are different kinds of information; even two WUE figures should not be treated as a regional ranking without matched definitions and boundaries. Microsoft’s explanation of how it measures datacenter energy and water efficiency describes measurement context and location factors. These public figures do not support naming a single provider or region as the “greenest” or lowest-water choice.
Independent reader supportYour contribution helps us test, update, and keep practical guides available for everyone.Use region tools as filters, not final decision-makers
| Tool | Useful for | Important limit |
|---|---|---|
| Google Cloud Region Picker | Screening Google Cloud locations using carbon footprint, price, and latency signals. | Its cost signal uses generic compute pricing, and its latency signal approximates distance between selected countries and a region’s city or country. Confirm service-specific prices and measure real paths. |
| Google Cloud Location Finder | Comparing locations across Google Cloud, Google Distributed Cloud, AWS, Azure, and OCI by network proximity; it uses measured round-trip time between locations and supports territory filters. | Its carbon-free-energy filters apply only to Google Cloud locations; it does not provide a comparable cross-provider water-stress metric. Google says third-party location data is drawn from public resources, is not guaranteed by Google, and is updated every 24 hours. |
| WRI Aqueduct | Investigating watershed water risk, including stress and seasonal variability. | A watershed risk indicator is not a cloud provider’s water consumed per unit of compute, nor a complete measure of a workload’s impact. |
| Provider water disclosures | Adding context on reported operational efficiency and water programs; label each figure’s period and reporting boundary. | Provider-wide figures do not identify water conditions or consumption for a specific region, and differing definitions prevent a simple ranking. |
Location Finder also documents filters for latency, territory, provider, and carbon-free energy in its query and filter syntax. A carbon-free-energy measure is a separate environmental dimension from water risk; Google’s explanation of carbon-free energy for Google Cloud regions describes its hourly accounting and 2030 goal. Do not substitute it for a watershed assessment.
What’s actually slowing this PC down?
Pick the symptom - the matching free tool is one click away.
Best Value

- EASY TO USE: Our turbidity meters are incredibly accurate, meeting ISO 7027 standards with the nephelometric method. By measuring light scattering in water, they provide precise results crucial for maintaining water quality and meeting regulatory requirements.
- WIDE APPLICATION: Use across different industries including power plants, water treatment facilities, sewage treatment plants, beverage factories, environmental agencies, industrial water management, pharmaceuticals, healthcare, and more.
- LARGE DISPLAY: This Sper Scientific Turbidity Meter displays the turbidity level of aqueous solutions on a large, bright LCD screen. It can measure numerous different types of aqueous solutions and offers an automatic, pushbutton 2point selfcalibration feature that can be performed in under a minute. Features include autoranging and minmax recall.
- CARRY CASE: Includes calibration solutions for 0 NTU and 100 NTU, sample cell bottles, distilled water, and cleaning cloth. With the convenience of additional calibration solution availability, users can rely on this all-inclusive solution for accurate turbidity measurements.
- HEAVY-DUTY: This turbidity meter is equipped with a reliable circuit system and a long-lasting light source, ensuring consistent and accurate performance even after extended periods of use.
Compare candidates with one consistent scorecard
For every region that passes the hard constraints, record the same information and note missing evidence rather than silently treating it as zero or equivalent. A useful decision sheet looks like this:
| Decision field | What to record |
|---|---|
| Eligibility | Residency and legal constraints; required service, machine, quota, and capacity availability. |
| Workload cost | Estimated full design cost, including compute, storage, managed services, network, redundancy, support, and the dated pricing assumptions. |
| Latency | Source locations, test conditions, network and application measurements, median and tail percentiles, and the relevant service target. |
| Local water risk | Facility or geographic proxy, watershed, indicator names, season or period, and data source. |
| Provider water disclosure | Metric, reporting year, facility or company boundary, and whether it refers to withdrawals, consumption, freshwater, reclaimed water, or WUE. |
| Resilience and uncertainty | Failure-domain design, cross-region transfer implications, missing evidence, and confidence in each estimate. |
There is no evidence-supported universal weighting for these fields. Interactive production services often have strict latency targets; flexible batch workloads may have more location choice. State which requirement drove the selection and which trade-offs remain instead of declaring one region the winner for every workload.
Quick Recap
Product prices and availability are accurate as of the date/time indicated and are subject to change. Any price and availability information displayed on Amazon at the time of purchase will apply.

