
iTechGuides is reader-supported. When you buy through links on our site, we may earn an affiliate commission. As an Amazon Associate I earn from qualifying purchases. Learn more
Bitcoin’s first support test is the $83,000–$84,000 zone, but a single trade or intraday wick cannot prove it has held. The stronger test is repeated daily closes above that area, followed by sustained spot buying. If buyers fail there, watch $81,300–$81,000, then the $80,000–$81,500 cost-basis band associated with US spot-ETF and corporate-treasury holders. A daily close below $80,000 would expose deeper support near $77,000–$77,600. These levels come from October 2026 market reports; the exact October 26 spot price and same-day ETF flows were not available in those reports.
What support levels matter for Bitcoin near $83,000?
Support is best treated as a ladder of price areas and confirmation tests rather than one exact number. The October analyses identify four zones, each based on different evidence.
| Zone | Evidence type | What would confirm it | Invalidation signal |
|---|---|---|---|
| $83,000–$84,000 | Near-term technical consolidation floor | Repeated daily closes above the zone, ideally with stronger spot volume | Sustained acceptance below $83,000 |
| $81,300–$81,000 | Former range high and macro pivot; independently marked first support | Price reclaims the pivot after a test and ETF flows turn consistently positive | Loss of the pivot followed by continued closes below it |
| $80,000–$81,500 | Estimated ETF and corporate-treasury cost-basis band | Buyers defend the band while holders remain near break-even | Daily close below $80,000 |
| $77,000–$77,600 | 50-day and 50-week moving-average area | Price stabilizes and forms higher lows | Failure of the zone would shift attention to lower levels, including $73,500 and $71,000 identified by 21Shares |
Technical levels can overlap with investor cost bases, but they do not guarantee an order will be filled there. Treat each band as an area in which to look for evidence, not as a forecast target.
Quick wins for a faster PC:
Fix the driver behind crashes, sound loss and screen glitchesFind Drivers →Repair Windows errors before they cause bigger problemsFix Now →Is the $83,000–$84,000 support holding?
XTB’s October 7 analysis said the market continued to respect $83,000–$84,000 as an important support zone. The practical test is whether Bitcoin can close above it repeatedly after probing lower, rather than merely printing a brief intraday recovery.
Popular on Amazon

- Unparalleled Security: Protect your assets NDA-free EAL 6+ Secure Element, offering robust defense and complete transparency
- Simple & Secure Interface: Manage your digital assets easily with a clear OLED screen for secure on-device confirmations
- Supports 1000s of Coins & Tokens: Securely handle thousands of assets, including Bitcoin, Ethereum, and more, all in one wallet
- Effortless Asset Management: Monitor and transact seamlessly with Trezor Suite, our intuitive desktop and mobile app
- Enhanced Backup Solution: Rest assured with Multi-share Backup, eliminating single points of failure for secure cold wallet recovery
What a stronger hold looks like
- Several daily closes remain above $83,000.
- Pullbacks are bought without progressively lower closing prices.
- Spot-market volume expands as price recovers.
- ETF flows are positive on more than one day, reducing the chance that one isolated inflow is noise.
A wick below the zone followed by a close back above it is a first sign of demand, but it is weaker than repeated closes accompanied by rising spot volume.
What happens if Bitcoin loses $81,000?
A sustained break of $81,300–$81,000 would weaken the recovery structure and move the next decision to the $80,000–$81,500 cost-basis band. Bitfinex described $81,300 as the former range high and macro pivot, while 21Shares listed approximately $81,000 as first support.
The distinction is between a quick violation and sustained acceptance. If price dips under $81,000 but quickly reclaims the pivot, the breakdown may be a liquidity sweep. Repeated closes below it, especially with weak spot demand, would make a test of $80,000 more likely.
Is the ETF cost basis acting as support?
Glassnode’s October 21 report placed the US spot-ETF cost basis near the October sweep and estimated corporate-treasury cost basis around $80,200. It warned that a daily close below $80,000 would leave both cohorts at an average loss. That makes $80,000–$81,500 an important on-chain and positioning band, but not a guaranteed floor.
Also popular on Amazon

- Unparalleled Security: Protect your assets with EAL 6+ Secure Element, offering robust defense and complete transparency
- Simple & Secure Interface: Manage your digital assets easily with a clear OLED screen for secure on-device confirmations
- Supports 1000s of Coins & Tokens: Securely handle thousands of assets, including Bitcoin, Ethereum, and more, all in one wallet
- Effortless Asset Management: Monitor and transact seamlessly with Trezor Suite, our intuitive desktop and mobile app
- Enhanced Backup Solution: Multi-share Backup eliminates single points of failure for secure cold wallet recovery
Cost basis matters because holders near break-even may defend positions or sell quickly if losses deepen. The signal is stronger when price holds the band while ETF inflows persist; it is weaker when flows are one-day events or trading volume is thin.
How do ETF flows and leverage confirm a support test?
Glassnode recorded $653 million of ETF inflows on October 19, yet characterized overall volume as thin. Bitfinex separately called spot demand the weakest part of the setup. Together, those observations mean a positive flow number alone is insufficient confirmation.
Look for repeated net inflows, rising spot turnover and price closes above the tested level. Also monitor leverage: Bitfinex reported $1.18 billion in crypto positions liquidated within 24 hours on October 8, after Bitcoin fell 7.9% from the October 2 high of $87,197 to an October 8 low of $80,347. That liquidation flush may remove some forced sellers, but it does not create lasting demand by itself.
Where is the next support below $80,000?
If Bitcoin posts a daily close below $80,000, the next clearly identified area is approximately $77,000–$77,600. 21Shares tied $77,600 to the 50-week average and $77,000 to the 50-day average. The same analysis identified lower reference levels near $73,500, the short-term realized price, and $71,000, the 200-day average.
Also popular on Amazon

- Dual-chip architecture for maximum protection: The next-gen, fully auditable TROPIC01 chip works alongside a certified EAL6+ Secure Element—completely NDA-free—to deliver radically transparent, industry-leading defense against physical attacks.
- Quantum-ready security: Get protection against future threats with the first-ever hardware wallet designed with quantum-ready architecture.
- See every detail with confidence: Our largest high-resolution color touchscreen makes it easy to navigate your assets, review transactions and manage your coins with clarity.
- Wireless freedom with encrypted Bluetooth control: Manage, buy, swap and stake securely using Trezor Suite on desktop or mobile. Qi2-compatible wireless charging keeps your Trezor powered up. No cables required—security meets convenience.
- Works seamlessly with Android, iOS and desktop: Connect wirelessly or via USB-C to your phone or computer. Manage your crypto anywhere with our companion Trezor Suite app.
Those deeper levels become relevant only after the higher bands fail. A move directly to them is not established by the October reports; they are conditional checkpoints for a continuing decline.
What would improve Bitcoin’s technical structure?
The first repair is a reclaim and hold of $84,000–$84,500, the immediate floor and ETF-cost-basis area highlighted by Bitfinex. A more meaningful structural improvement would be a clear move above $86,500. XTB associated that level with a better technical structure, while Glassnode placed heavier asks and liquidation clusters between roughly $85,000 and $87,500.
Bitcoin therefore faces overhead supply even if $83,000 holds. A breakout that stalls inside $85,000–$87,500 would show resistance remains active; holding above $87,500 would remove the specific October supply zone from immediate focus, though it would not guarantee a new uptrend.
The Tool Desk
Outbyte PC Repair FREERepair Windows errors before they cause bigger problemsFix Now →Outbyte Driver Updater FREEScan for outdated or missing drivers - takes under a minuteDriver Scan →How should traders interpret the October context?
September 2026 rose 6.2%, according to 21Shares, despite its cited long-run average September loss of 2.4% since 2013 (using Coinglass data). That seasonal comparison describes historical context, not a rule for October or a prediction for the next move. Glassnode’s Frederik Theissen summarized the near-term condition as “Bitcoin is still boxed in,” reflecting the defined support and resistance bands rather than a confirmed breakout.
Also popular on Amazon
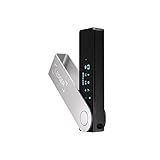
- Effortlessly build your crypto portfolio via the all in one Ledger Wallet app: buy, sell, send, receive, swap, stake and more across popular blockchains. 15,000+ coins & tokens in a single dashboard. Keep a close eye on the market. Compare service providers. Track performance. Get timely alerts. Build your portfolio with confidence.
- Enjoy Bluetooth connectivity, iOS access, and hours of battery use with this mobile-first, secure backup signer. Freedom you can depend on.
- Genuine Check: confirm your signer is authentic during setup with the Ledger Wallet app.
- Protect your signer: keep it in mint condition at all times with a bespoke Pod or Case to avoid scratches and everyday wear and tear.
Because the available reports stop short of October 26’s live quote and same-day ETF data, any decision should refresh those two fields before acting. The levels above are published October 2026 reference points, not guaranteed targets.
Frequently Asked Questions
Is a Bitcoin wick below $83,000 automatically bearish?
No. A wick shows that sellers traded below the zone, but a close back above it can indicate buyers absorbed that supply. Repeated closes below the area carry more bearish information than one intraday excursion.
Why does a daily close below $80,000 matter more than $81,000?
The $80,000 threshold is tied to the estimated average cost bases of ETF and corporate-treasury holders. Glassnode indicated that a daily close below it would put both groups underwater on average, potentially changing their behavior.
PC Slower Than It Used to Be?
A free scan shows the junk files, broken settings and background clutter dragging Windows down - then fixes them in one click.Free scan · Windows 10 & 11Crashes, No Sound, or Screen Glitches?
Random freezes, missing sound and display glitches usually trace back to one bad driver. Find and replace yours safely.Free scan · under a minuteCan ETF inflows alone confirm Bitcoin support?
Not reliably. The October reports described a $653 million inflow day but also noted thin volume and weak spot demand. Confirmation is stronger when inflows recur alongside rising spot turnover and closes above the tested level.
What is the difference between the $77,000 and $77,600 levels?
They are separate moving-average references: 21Shares associated approximately $77,000 with the 50-day average and $77,600 with the 50-week average. Their proximity makes them a zone rather than two precise trigger prices.
Quick Recap
Product prices and availability are accurate as of the date/time indicated and are subject to change. Any price and availability information displayed on Amazon at the time of purchase will apply.

