
Do these 3 things before closing this tab:
1Repair Windows errors before they cause bigger problems2Fix the driver behind crashes, sound loss and screen glitches3Clear out junk files and repair common Windows errorsiTechGuides is reader-supported. When you buy through links on our site, we may earn an affiliate commission. As an Amazon Associate I earn from qualifying purchases. Learn more
The best resources to learn statistics for free are usually used together: start with Khan Academy for fundamentals and practice, use OpenIntro Statistics as your main textbook, add MIT OpenCourseWare or Harvard for rigor, and finish with real-data projects in R, Python, Jamovi, or JASP. No single free resource fits every goal.
“Free” does not always mean the same thing. An open textbook may be permanently available, while a course platform may offer only a preview, an audit, selected assessments, or a time-limited trial. The most useful choice depends on whether you want statistical literacy, college-level preparation, applied data analysis, probability, research skills, or mathematical statistics.


Key takeaways
- Khan Academy’s Statistics and Probability course is the most approachable starting point for beginners because it combines explanations, practice, quizzes, and progression tracking.
- OpenIntro Statistics is the strongest general-purpose free textbook, with online and PDF editions, exercises, datasets, videos, labs, and software materials.
- MIT OpenCourseWare 18.05 provides a more rigorous university-style route, but free access does not include academic credit, instructor grading, or a certificate.
- Harvard Statistics 110 is an excellent free probability resource, but it is probability-heavy rather than a complete applied-statistics curriculum.
- Coursera and edX should be labeled carefully: a particular course may be free to audit, available as a preview, covered by a trial, or paid for full access and certification.
- You learn statistics more reliably by analyzing real datasets and explaining uncertainty than by watching videos or memorizing formulas alone.
Which free statistics resource is right for your goal?
The best free statistics resource depends on the result you want. A beginner who needs intuition should not start with a proof-oriented probability course, and a data-science learner should not stop after completing short arithmetic exercises.
| Your goal | Primary resource | Useful supplement | Why this combination works |
|---|---|---|---|
| Absolute beginner or high-school review | Khan Academy Statistics and Probability | OpenIntro Statistics | Khan Academy builds procedural fluency; OpenIntro supplies a coherent textbook and realistic exercises. |
| College statistics review | OpenIntro Statistics | MIT OpenCourseWare 18.05 | OpenIntro provides the main sequence; MIT adds harder probability and inference problems. |
| Data science preparation | Introduction to Modern Statistics | Interactive R tutorials and Harvard Statistics and R | The modern text connects inference to data wrangling, visualization, simulation, and reproducible analysis. |
| Probability depth | Harvard Statistics 110 | Introduction to Probability | The lectures and free textbook develop conditional probability, distributions, combinatorics, and stochastic thinking together. |
| Research, health, or social science | OpenIntro Statistics | Harvard Statistics and R | The first resource develops study-design and inference foundations; the second connects those ideas to R. |
| Mathematical or graduate preparation | MIT 18.05 | Harvard Statistics 110 | Both require persistence with algebra and probability notation and provide more rigorous problem-solving practice. |
What does “learn statistics” mean?
Learning statistics can describe several different targets, and the targets require different resources.
Popular on Amazon

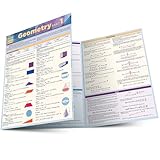
- This guide is a perfect overview for the topics covered in introductory statistics courses.
- Statistical literacy: reading charts, understanding averages and variability, recognizing misleading claims, and interpreting risk and uncertainty.
- Introductory academic statistics: descriptive statistics, probability, sampling, confidence intervals, hypothesis tests, correlation, regression, and experimental design.
- Applied data analysis: cleaning data, visualizing information, using R or Python, creating reproducible analyses, and communicating findings.
- Mathematical statistics: probability theory, estimation, likelihood, asymptotics, proofs, and derivations.
- Specialized statistics: biostatistics, econometrics, Bayesian statistics, survey sampling, time series, causal inference, experimental design, or machine learning.
A list of “best statistics courses” becomes misleading when it treats probability, data science, machine learning, and introductory statistics as interchangeable. Choose the outcome first, then choose the resource.
What are the best free resources to learn statistics?
1. Khan Academy Statistics and Probability: best starting point for most beginners
Khan Academy’s Statistics and Probability course is the best first stop for learners who need clear explanations followed by immediate practice. The course page identifies 16 units and 157 skills, covering topics such as distributions, study design, probability, sampling distributions, confidence intervals, hypothesis tests, chi-square tests, regression, and ANOVA.
Khan Academy is especially useful for learning the language of statistics: variables, tables, graphs, means, medians, spread, probability, and the difference between describing a sample and making an inference about a population. Practice, quizzes, and mastery tracking help learners identify gaps without needing a teacher.
The Tool Desk
Outbyte PC Repair FREERepair Windows errors before they cause bigger problemsFix Now →Outbyte Driver Updater FREEFix the driver behind crashes, sound loss and screen glitchesFind Drivers →Use Khan Academy for:
- Mean, median, quantiles, spread, and distributions.
- Histograms, scatterplots, and two-way tables.
- Probability fundamentals.
- Sampling and study design.
- Confidence intervals and hypothesis testing.
- Introductory regression and ANOVA.
Limitations: Khan Academy is not a substitute for designing a complete study, working with messy real-world data, or writing a defensible statistical explanation. Short exercises can also encourage answer-getting instead of interpretation. Complete relevant units in order, but do not spend weeks perfecting every arithmetic exercise before applying the ideas to actual datasets.
Best companion: Read the corresponding chapters in OpenIntro Statistics and reproduce at least one example with a dataset.
2. OpenIntro Statistics: best free conventional textbook
OpenIntro Statistics is the strongest central resource for a conventional introductory statistics course or independent study. OpenIntro provides a free web version and PDF, learning objectives, datasets, videos, slides, labs, and software materials. Its progression covers data collection, sampling, probability, inference, regression, and experiments.
OpenIntro is a better “main course” than a disconnected collection of videos because the chapters, objectives, exercises, and datasets form one sequence. The site identifies R, Python, Jamovi, JASP, and other tools used with its labs, allowing learners to connect concepts with analysis.
Use it effectively:
- Read the learning objectives before starting a chapter.
- Work selected exercises without checking the answer immediately.
- Download or open the associated dataset.
- Recreate at least one analysis in R, Python, Jamovi, or JASP.
- Write the conclusion in context instead of reporting only “reject” or “fail to reject.”
- Use chapter videos to clarify difficult ideas, not to replace exercises.
Some instructor materials and solutions may be restricted even though the student-facing book and many supporting resources are free. A free PDF is enough to learn; a printed edition is a convenience purchase, not a prerequisite.
Best companion: Khan Academy for prerequisite explanations or Harvard Statistics and R for implementation.
3. Introduction to Modern Statistics: best for data-oriented learning
Introduction to Modern Statistics is a free web and PDF textbook designed for learners who want statistics connected to modern data analysis. The book emphasizes visualization, data wrangling, simulation, randomization, inference, and reproducible computing rather than relying only on hand calculations.
The online materials include interactive R tutorials using the tidyverse and the infer package. The online second-edition page identifies a version date of March 31, 2026; software interfaces and package behavior can change, so learners should follow the current materials rather than assume every older tutorial label remains unchanged.
What’s actually slowing this PC down?
Pick the symptom - the matching free tool is one click away.
This book is particularly suitable for data science, social science, research, and applied analysis. Randomization and simulation can make inference more intuitive because learners can see how sampling variability produces a distribution of possible results.
Trade-off: Readers expecting a formula-first, traditional syllabus may find the computing-centered approach unfamiliar. Pairing the book with Khan Academy works well when prerequisite explanations are needed.
Also popular on Amazon

- Quick reference Statistics chart
- This 8.5" x 11" 4-page laminated Guide provides an easy to follow summary of all basic principles that are the foundation to Statistics and Probabilities
- Detailed descriptions and examples of theory
- Using a combination of charts and sample equations, the key concepts are developed and the essential Statistics theories are outlined.
- Easy-to-read to promoted memory retention. Great quick reference aid.
Best companion: Harvard Statistics and R or a small project using a public dataset.
4. MIT OpenCourseWare 18.05: best rigorous free course
MIT OpenCourseWare’s 18.05 Introduction to Probability and Statistics is the strongest option for learners who want a structured university-level course. The course covers combinatorics, random variables, probability distributions, Bayesian inference, hypothesis testing, confidence intervals, and linear regression. Materials include lectures, problem sets, exams, R resources, and interactive components.
Quick wins for a faster PC:
Scan for outdated or missing drivers - takes under a minuteDriver Scan →Clear out junk files and repair common Windows errorsFree Scan →Fix the driver behind crashes, sound loss and screen glitchesFind Drivers →MIT’s OpenCourseWare guidance explains that OCW materials are free to browse and use without registration, enrollment, or fixed start and end dates. MIT OCW does not provide academic credit or certification, and ordinary self-study does not include instructor grading or personal feedback.
Best for: Learners comfortable with algebra who want problem sets and exams, students reviewing a university course, and readers who want probability and inference treated seriously.
Prerequisites: Algebraic fluency, comfort with functions, and persistence with probability notation are more important than advanced calculus for this course.
Limitation: MIT 18.05 is not the gentlest first exposure for someone still learning what variables, samples, and distributions mean. Start with Khan Academy or OpenIntro if the notation becomes a barrier.
Free tools Windows power users keep installed
One-click scans. No signup required.
5. Harvard Statistics 110: best free probability resource
Harvard Statistics 110 is an excellent free route into probability, combinatorics, and stochastic thinking. The site links to lecture videos, the free online edition of Introduction to Probability by Joe Blitzstein and Jessica Hwang, and an edX version known as Stat110x. The edX course complements the lectures with animations, interactive features, readings, and problem-solving.
Statistics 110 is valuable for conditional probability, Bayes’ rule, random variables, distributions, expectation, variance, and probability models used later in statistics and machine learning.
Do not use it as your only introductory statistics course: Harvard Statistics 110 is primarily a probability course. It does not replace a full applied curriculum covering data collection, study design, confidence intervals, regression, and practical data analysis.
Recommended sequence: Learn descriptive statistics and study design with Khan Academy or OpenIntro first, then use Statistics 110 when you want deeper probability.
Recommended Free Tools
6. Harvard Statistics and R: best for inference with R
Harvard’s Statistics and R covers statistical inference, p-values, confidence intervals, and analysis using R. Harvard states that learners may audit the edX-delivered course for free with selected materials, activities, tests, and forums.
Statistics and R suits learners who already understand basic descriptive statistics and want to connect inference concepts to code. It is especially relevant to public-health, biology, and life-science learners.
Important access qualification: Audit access is not necessarily the same as full paid access. Confirm the current course page before assuming that every graded assignment, assessment, forum feature, or certificate is included at no cost.
Also popular on Amazon
7. Coursera: useful for sampling structured courses, not automatically free
Coursera’s statistics catalog can help learners compare university-style and career-oriented courses. The catalog includes beginner options associated with institutions and organizations such as Stanford, the University of Amsterdam, Meta, and Google.
PC Slower Than It Used to Be?
A free scan shows the junk files, broken settings and background clutter dragging Windows down - then fixes them in one click.Free scan · Windows 10 & 11Crashes, No Sound, or Screen Glitches?
Random freezes, missing sound and display glitches usually trace back to one bad driver. Find and replace yours safely.Free scan · under a minuteCoursera’s access labels require careful reading. The catalog may offer a first-module preview, a seven-day free trial for eligible Specializations or Coursera Plus offerings, or courses marked free. Coursera’s free-statistics results distinguish “Free” from “Preview” and state that certificates or continued access may require an upgrade or financial aid.
Use Coursera when: You need a paced sequence, deadlines, graded workflows, a certificate option, or a career-oriented specialization.
Do not describe every Coursera result as permanently free: A preview, audit, trial, and unrestricted course access are different products. Check the individual course’s current terms, regional availability, and expiration conditions.
8. edX: university courses with course-specific access rules
edX’s statistics catalog lists courses from Harvard, Stanford, and other institutions, including material related to introductory probability, statistical learning with R, and R basics.
Many edX courses can be audited without a certificate, but the precise access period, assessments, forums, and downloadable materials vary by course. A verified certificate and extended or graded access may require payment.
Use edX when: You want to compare university-branded courses or follow a platform pathway. Treat the individual course page—not the catalog headline—as the authority for what “free” includes.
Which free statistics textbooks are best?
For most beginners and college students, OpenIntro Statistics is the best primary textbook because it combines a coherent introduction with exercises, datasets, labs, videos, and software support.
| Textbook | Best use | Free access | Main trade-off |
|---|---|---|---|
| OpenIntro Statistics | Traditional introductory statistics | Free web version and PDF, datasets, videos, labs, and software materials | Some instructor materials and solutions may be restricted. |
| Introduction to Modern Statistics | Data-oriented statistics and reproducible analysis | Free web and PDF versions plus interactive R tutorials | Less familiar to learners expecting a formula-first textbook. |
| Introduction to Probability by Blitzstein and Hwang | Probability, combinatorics, and preparation for advanced statistics | Free online edition linked by Harvard Statistics 110 | Probability-heavy and not a complete applied-statistics text. |
| OpenStax statistics-related textbooks | Additional free textbook-style study material | OpenStax offers free online textbooks | Choose a title based on the exact syllabus; a general free textbook is not automatically the best fit. |
OpenIntro also lists print formats. The dossier reports approximate observed prices of $25 for a black-and-white paperback and $40 for a color paperback for OpenIntro Statistics, and approximately $25 for the black-and-white paperback of Introduction to Modern Statistics. Prices vary by country, retailer, format, and date, so the free digital editions remain the zero-cost default.
What should a complete beginner study first?
A complete beginner should learn concepts in an order that moves from describing data to reasoning under uncertainty and then to modeling.
- Variables, populations, samples, and observational units: Learn what was measured, on whom or what, and what the data represent.
- Tables and graphs: Read counts, proportions, histograms, boxplots, scatterplots, and two-way tables.
- Center and variability: Understand mean, median, quantiles, range, standard deviation, and the effect of outliers.
- Probability fundamentals: Learn events, complements, unions, conditional probability, and independence.
- Random variables and distributions: Connect possible outcomes to probabilities, expected values, and variation.
- Sampling and bias: Distinguish a target population from an available sample and identify selection and measurement problems.
- Sampling distributions and the central limit theorem: Understand why estimates vary from sample to sample.
- Confidence intervals: Report a range of plausible values with its uncertainty and context.
- Hypothesis tests: Interpret evidence against a specified null model without treating a p-value as a verdict about truth.
- Effect sizes and practical significance: Ask whether a difference matters, not only whether it is statistically detectable.
- Correlation and regression: Describe associations and predictions while avoiding automatic causal claims.
- Experimental design and causal reasoning: Learn why random sampling and random assignment answer different questions.
- Software workflow: Analyze real data, document decisions, check assumptions, and communicate limitations.
Calculus is not required for statistical literacy or most introductory applied statistics. Calculus, more advanced probability, linear algebra, and proof practice become important for mathematical statistics and some graduate-level work.
Should you learn R, Python, Jamovi, or JASP?
Learn statistical reasoning before committing to a software interface. A tool can calculate a result, but a tool cannot decide whether the data were sampled fairly, whether an assumption is plausible, or whether a statistically significant result matters.
| Tool | Best use | Advantages | Drawbacks |
|---|---|---|---|
| R | Statistics, research, visualization, and reproducible reports | Excellent statistical ecosystem and strong academic support | Steeper initial learning curve. |
| Python | Data science, automation, and machine learning | Broad programming ecosystem and strong general-purpose flexibility | Statistics workflows can feel less integrated for beginners. |
| Jamovi | Point-and-click introductory analysis | Beginner-friendly and relatively transparent | Less flexible for advanced automation. |
| JASP | Point-and-click frequentist and Bayesian analysis | Accessible interface with strong teaching value | Less general-purpose than R or Python. |
| Spreadsheet software | Simple descriptive summaries | Familiar and immediate | Easy to introduce formula, sampling, and reproducibility errors. |
For a statistics-first path, choose R if you want research, visualization, and reproducible reports. Choose Python if you also want broader programming, automation, or machine learning. Choose Jamovi or JASP if code is initially a barrier and your goal is to understand introductory analyses. Move to code when you need repeatability, larger datasets, or a documented workflow.
Also popular on Amazon
Pair every software exercise with five questions: What is the research question? What quantity or estimand is being measured? What assumptions are being made? What does the output mean in context? What limitations remain?
What is a practical free six-month study plan?
A six-month plan can provide a useful structure, but it cannot guarantee mastery. Progress depends on prior algebra, available time, and whether each week includes active problem-solving rather than passive viewing.
| Month | Focus | Suggested resources | Finish line |
|---|---|---|---|
| 1 | Data description and visualization | Khan Academy; OpenIntro chapters on data | Describe variables, make appropriate graphs, and explain center and spread. |
| 2 | Probability and distributions | Khan Academy; relevant OpenIntro chapters | Explain conditional probability, independence, random variables, and common distributions. |
| 3 | Sampling and inference | OpenIntro; Khan Academy confidence intervals and tests | Explain sampling variability, confidence intervals, p-values, and assumptions. |
| 4 | Regression and study design | OpenIntro or Introduction to Modern Statistics | Interpret associations, identify confounding, and distinguish observational from experimental evidence. |
| 5 | R or Python workflow | Introduction to Modern Statistics tutorials; Harvard Statistics and R | Import data, visualize it, run an analysis, and document the steps. |
| 6 | Independent projects and paper interpretation | OpenIntro datasets; MIT or Harvard supplements | Complete two projects and explain conclusions, uncertainty, assumptions, and limitations to a nontechnical reader. |
Do not take six courses simultaneously. Select one primary textbook or course and one supplement. Course-shopping can feel productive while replacing the exercises that create actual competence.
How can you practice statistics for free?
Free practice should resemble the decisions statisticians make, not only the arithmetic found in isolated exercises. OpenIntro’s datasets and project examples are a useful starting point.
- Choose a question that can be answered with data.
- Find or collect a dataset.
- Identify the observational unit and define every important variable.
- Make a graph before calculating a test.
- State the assumptions of the chosen method.
- Run the analysis by hand for a small example or in software for a realistic dataset.
- Report uncertainty and effect size, not only a p-value.
- Explain the result in plain language.
- List limitations, possible bias, and alternative explanations.
- Reproduce the result in a second tool or by independently checking a small sample.
A learner is ready to move beyond introductory material when the learner can choose a method for a stated question, explain why the method fits, identify what could invalidate the conclusion, and communicate the result without hiding behind software output.
Independent reader supportYour contribution helps us test, update, and keep practical guides available for everyone.Which statistics misunderstandings should you avoid?
Correlation is not causation
A correlation or regression relationship describes an association. A causal claim requires a design or identification strategy that supports causation; regression output alone does not automatically provide one.
A p-value is not the probability that the null hypothesis is true
A p-value describes how unusual the observed result, or a more extreme result, would be under a specified null model. A small p-value does not measure the probability that the null hypothesis is false.
Statistical significance is not practical importance
A very large sample can detect a tiny effect, while a meaningful effect may fail to reach a conventional significance threshold in a small or noisy sample. Report the size and uncertainty of the effect.
A confidence interval is not a simple probability statement about one fixed parameter
The repeated-sampling interpretation concerns the procedure that generated the interval. Explain the interval in the context of the method and its assumptions rather than saying that the fixed parameter has a particular probability of lying inside one realized interval.
A larger sample does not automatically remove selection bias
A large biased sample can estimate the wrong target precisely. Sampling design, measurement quality, missing data, and representativeness matter before sample size can help.
Random sampling and random assignment solve different problems
Random sampling helps connect a sample to a wider population. Random assignment helps balance groups in an experiment and supports causal comparison. One does not substitute for the other.
“Fail to reject” does not prove that two groups are identical
Failing to find strong evidence against a null hypothesis may reflect limited information, high variability, or a genuinely small effect. It is not proof of exact equality.
The Tool Desk
Outbyte PC Repair FREEClear out junk files and repair common Windows errorsFree Scan →Outbyte Driver Updater FREEScan for outdated or missing drivers - takes under a minuteDriver Scan →More data cannot compensate for poor measurement or biased design
Additional observations do not fix a question that was measured badly, a sample that excludes important groups, or an analysis that ignores dependence and confounding.
Also popular on Amazon
Multiple testing increases false-positive risk
Testing many hypotheses creates more opportunities for apparently significant results by chance. A responsible analysis should account for the number and purpose of comparisons.
Averages can conceal important structure
A mean can hide skew, outliers, subgroups, and unequal experiences. Inspect distributions and relevant groups before relying on a single summary.
How should you judge whether a resource is genuinely free?
Use a precise access label rather than assuming that a university logo or a “free course” search result means unrestricted access.
Do these 3 things before closing this tab:
1Repair Windows errors before they cause bigger problems2Scan for outdated or missing drivers - takes under a minute3Clear out junk files and repair common Windows errors| Access label | What it usually means | What to verify |
|---|---|---|
| Permanently free | The material is openly available without a trial expiration. | Whether solutions, datasets, downloads, and software materials are also public. |
| Free to audit | Learning materials may be available without payment, but graded work, forums, or a certificate may be limited. | Which activities and assessments are included and how long access lasts. |
| Free preview | Only an introductory module or sample is available. | Whether the remaining chapters, assignments, and tests require payment. |
| Free trial | Full or expanded access is available temporarily for eligible users. | Trial duration, renewal terms, regional eligibility, and cancellation requirements. |
| Paid certificate | Learning may be free or audited, while credential issuance costs money. | Whether the credential has value for the learner’s specific school or employer goal. |
MIT OpenCourseWare is an especially clear example: the materials are free and self-paced, but free access does not provide academic credit or certification. OpenIntro’s digital books are also free, while print editions and some instructor resources may cost money. Coursera and edX require course-specific checking because access rules vary.
What should you study after introductory statistics?
After introductory statistics, choose the next subject based on the questions you need to answer rather than jumping directly to machine learning.
- Research or health: study biostatistics, epidemiology, survey methodology, experimental design, and domain-specific interpretation.
- Social science: add regression, causal inference, measurement, survey sampling, and missing-data methods.
- Business or forecasting: study regression, time series, experiments, and decision analysis.
- Data science: strengthen programming, probability, linear algebra, model evaluation, and statistical learning.
- Mathematical statistics: add calculus, linear algebra, proof practice, advanced probability, estimation, likelihood, and asymptotic reasoning.
- Bayesian analysis: deepen probability and learn prior specification, posterior inference, computation, and model checking.
Free introductory resources can prepare you for a college statistics course when you actively work exercises and understand the concepts, but completion alone does not guarantee a particular grade or academic outcome. Free resources also do not, by themselves, qualify someone for a statistics job.
Frequently Asked Questions
Can I really learn statistics for free?
Yes. You can learn introductory statistics without paying by combining Khan Academy, an OpenIntro textbook, free MIT or Harvard materials, and hands-on projects with real datasets. Free access may not include instructor feedback, academic credit, graded assessments, or certificates.
Recommended Free Tools
Is Khan Academy enough to learn statistics?
Khan Academy is enough for a useful first foundation, but it is not ideal as a complete statistics curriculum. Add OpenIntro Statistics for coherent reading and exercises, then practice with real datasets and a software workflow.
Which free statistics textbook is best?
OpenIntro Statistics is the best general-purpose free textbook for most beginners and college students because it includes a structured progression, exercises, datasets, labs, videos, and software materials. Introduction to Modern Statistics is a better fit for data-oriented and computing-centered study, while Harvard’s Introduction to Probability is better for probability depth.
Do I need calculus to learn statistics?
You do not need calculus for statistical literacy or most introductory applied statistics. Algebra is generally enough for early Khan Academy material, while calculus and more advanced probability become important for mathematical statistics and some graduate-level work.
Are Coursera and edX statistics certificates free?
Coursera and edX certificates are not automatically free. A course may offer a free preview or audit, while a certificate, graded assessments, continued access, or full program access may require payment or financial aid; check the individual course page.
Free tools Windows power users keep installed
One-click scans. No signup required.
Should I learn R or Python first for statistics?
Choose R first for statistics, research, visualization, and reproducible reports; choose Python first if your broader goal includes programming, automation, or machine learning. Jamovi and JASP are good point-and-click starting tools, but software should follow statistical concepts rather than replace them.
How can I practice statistics without a teacher?
Choose a data question, find a dataset, identify the observational unit and variables, graph the data, state assumptions, run an analysis, report uncertainty and effect size, and explain limitations in plain language. Reproduce the result or check it independently before accepting the conclusion.
The Bottom Line
Bottom line: Start with Khan Academy if you are new, make OpenIntro Statistics your main free textbook, use Introduction to Modern Statistics for a computing-centered approach, and add MIT 18.05 or Harvard Statistics 110 when you need more rigor. Treat Coursera and edX access labels carefully, and consider your statistics foundation incomplete until you can analyze real data and explain what the result does—and does not—show.
Quick Recap
Product prices and availability are accurate as of the date/time indicated and are subject to change. Any price and availability information displayed on Amazon at the time of purchase will apply.
Quick wins for a faster PC:
Clear out junk files and repair common Windows errorsFree Scan →Fix the driver behind crashes, sound loss and screen glitchesFind Drivers →
