
Outdated Drivers Are Slowing You Down
One free scan finds every outdated or missing driver and matches the right update for your exact hardware.Free scan · exact hardware matchPC Slower Than It Used to Be?
A free scan shows the junk files, broken settings and background clutter dragging Windows down - then fixes them in one click.Free scan · Windows 10 & 11iTechGuides is reader-supported. When you buy through links on our site, we may earn an affiliate commission. As an Amazon Associate I earn from qualifying purchases. Learn more
Flourish is the best choice for a genuinely data-driven animated line chart in 2026. Its no-code editor supports time sliders, row and series filters, adjustable step timing, transition controls, annotations, forecasts, small multiples and story-style presentations. Choose Visme instead when the chart belongs inside an animated presentation or infographic. Canva is stronger for branded, design-led graphics; Datawrapper for publishing and team collaboration; and Infogram for interactive reports and dashboards. The key distinction is whether you need data to advance through time or simply want a chart object to move as part of a presentation. The comparison below separates those workflows so you can choose an appropriate tool rather than assuming every animated chart behaves the same way.
At a glance
| Name | Best for | Key capability | Checked |
|---|---|---|---|
| Flourish | Data-driven animation and time sliders | No-code animated line charts with filters, transitions, forecasts and stories | Oct 2026 |
| Visme | Animated presentations and infographics | Charts are animated and interactive in published URLs, embeds and HTML5 | Oct 2026 |
| Canva | Branded line-graph design | XLSX, CSV and TSV imports, 20+ graph types, templates and embedding | Oct 2026 |
| Datawrapper | Publishing and collaboration | Responsive previews, embeds, PowerPoint and print outputs, themes and real-time collaboration | Oct 2026 |
| Infogram | Interactive reports and dashboards | Charts, dashboards, embeds, data import, integrations and API capabilities | Oct 2026 |
What is the best animated line chart maker?
For an animation that reveals how values change over time, Flourish is the clearest fit. You can load data in wide or long format, attach a time slider, control each step’s timing and transition behavior, and add filters, popups, annotations or a story sequence without writing code.
Visme is the better answer when the chart is one element in a designed presentation. Its charts are animated and interactive by default in published web experiences, but downloaded MP4 and GIF files are static. Canva, Datawrapper and Infogram are useful for design, publication and reporting respectively, yet the cited product information does not establish a comparable data-driven line-chart animation workflow for them.
What’s actually slowing this PC down?
Pick the symptom - the matching free tool is one click away.
1. Flourish: best for true data-driven animation
Flourish is the strongest all-round pick when the chart itself must advance through periods, rather than merely appear with a decorative entrance effect. The vendor describes its line-chart workflow as no-code and supports both interactive and animated output.
Popular on Amazon
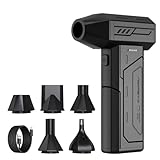
- Powerful Turbo Fan:CAGIWIRU Electric Air Duster have reached speed up to 130000RPM,Can efficient remove dust and debris.With LED light and Three Adjustable Speed to meet with different cleaning tasks.
- With Attached USB C Fasting Charging cable.Charing 3 hours,Enjoy up to 240 minutes of use on the lowest setting, For third speed can use for 25mins.with four charging options to meet with your needs.
- Wide Application: attached 5 different nozzles,making it suitable for a variety of scenes, such as car,pet, pc, keyboards, and other electronic devices. It also serves for office and home clean duster.
- Handy Design & Portable:Cordless air duster electric nozzle is Light weight and small size, design and comfortable to hold and space saving, convenient to carry around. You can put it in your room or inside the car without taking up space.
- Economical &Reusable: Built durable materials with a long-lasting battery,our CAGIWIRU air duster it's a sustainable alternative to disposable air cans.
What it does
You can build a line chart from a spreadsheet-style data table, then expose a time slider, row filter or series filter so viewers can move through the data. Flourish also supports hover behavior, legends, popups, small multiples, projections, annotations and multi-step stories. Those controls let a reader inspect a specific date, isolate a series or follow a guided narrative instead of watching a fixed clip.
Data workflow and animation controls
Use wide format when one X-axis column is followed by separate columns for each period or series. For more than one animated line, long format is recommended: one X-axis column, one value column and one period column. In the editor, choose a time-slider control for wide data or bind a row filter to a time slider for long data. Step timing, animation toggles, color behavior and fixed Y-axis minimum and maximum values are exposed as settings, which helps prevent the scale from shifting in a misleading way as the animation advances.
Where it runs and how you publish
The workflow is browser-based and code-free. Finished visualizations can be shared as published URLs or responsive embeds, and stories can combine several chart states into a guided sequence. This makes Flourish suitable for newsroom pages, public data explainers, business reporting and classroom material where the audience needs to interact with the chart.
Recommended Free Tools
Limits to plan for
- Your source table must follow the chosen wide or long structure; a poorly mapped period column will produce an incorrect slider.
- A time slider is a data-state control, not a conventional video timeline. It is designed for interaction in a browser or embed.
- Export requirements should be decided early if a project must become a standalone video, because the documented workflow centers on published interactive visualizations and stories.
2. Visme: best for animated presentations and infographics
Visme is the most natural choice when a line chart needs to live inside a presentation, infographic or other designed canvas. The vendor states that its charts and graphs are animated and interactive by default.
What it does
You can place a line chart alongside text, icons, illustrations and other presentation elements, then publish the composition as an interactive web experience. The animation is presentation-oriented: it helps a chart enter or progress within a designed page rather than concentrating on a data-specific time slider.
Output behavior
Animation is preserved in published URLs, embeds and HTML5 output. The help documentation specifies an important distinction for downloadable files: MP4 and GIF downloads remain static. If motion is essential, share the published or embedded version instead of assuming a downloaded video will retain the chart’s animation.
Where it fits
Use Visme for investor decks, educational explainers, marketing infographics and presentation pages where visual hierarchy matters as much as the numbers. Its web outputs let an audience interact with the chart in context, while HTML5 is useful when a self-contained interactive presentation is required.
The Tool Desk
Outbyte PC Repair FREEClear out junk files and repair common Windows errorsFree Scan →Outbyte Driver Updater FREEFix the driver behind crashes, sound loss and screen glitchesFind Drivers →Also popular on Amazon

- Screen Cleaner is Your Screen’s New Bestfriend! - EVEO is proud to present a screen cleaner that’s perfectly suited for your TV. Meet your new screen cleaner, computer screen cleaner, laptop cleaner, iPad cleaner, Macbook,tv cleaner or any other electronic device. Our screen cleaner spray and wipe along with the included plush microfiber cloth, easily removes dust, fingerprints & other smudges on the screen’s surface. Clean effectively for a streak-free screen
- Gentle on your Screens - Our screen cleaner spray and wipes is compatible to be used even for the most sensitive LCD, LED, CRT, and OLED screens in proper use. Be at ease knowing that this product is compatible with all the major brands: LG, SONY, Samsung, Sharp, iPad, iPhone, Android screens, Kindle, PC monitors - we’ve got you covered! Can be used as LCD screen cleaner, tv cleaner, smart tv screen cleaner, and more
- Premium Super Soft Plush Microfiber Cloth - Included in this efficient screen cleaning kit. This screen cleaner spray and wipe has our signature plush microfiber cloth specially designed to comply with screens and monitors and leave them streak-free. Has been shown to effectively absorbs stubborn stains, zero streaks, and no fiber shedding. Always use this together with our screen cleaner for the best results
- Easy-to-Use Screen Cleaner Kit + microfiber cleaning cloth - The EVEO Screen Cleaning Kit will easily be your new favorite tool when it comes to taking care of the things you love most, quick and easy solution for a streak-free screen. Simply screw on the sprayer gun on the screen cleaner bottle. Spray the cleaning liquid onto the microfiber cloth, then wipe the screen until desired cleanliness & shine is achieved.
- Quality Screen Care Kit Worth Purchasing - Enjoy a convenient Screen Cleaner anytime, anywhere you need it. Your satisfaction is our top priority. We stand behind the quality of our products and that’s why, you shouldn’t be worrying at all. We manufacture the Best Screen Cleaner. and can be used for laptop cleaning kit, laptop screen cleaner, tv screen cleaner for smart tv. MacBook screen cleaner, monitor cleaner or screen cleaner spray for electronic devices with microfiber cleaning cloth
Limits to plan for
- Do not select Visme solely because you need an animated MP4 or GIF; the documented downloads are static.
- For a chart that must scrub through dates with a dedicated data slider, Flourish provides the clearer documented workflow.
- Presentation animation can emphasize a narrative, but it is not the same as animating the underlying series through time.
3. Canva: best for branded, design-first line graphs
Canva is a practical option when the main requirement is a polished, on-brand line graph for a slide, social graphic, report page or other visual asset. Its documented strengths are import flexibility, templates and design controls rather than a confirmed data-driven animation system.
What it does
The line-graph maker accepts XLSX, CSV and TSV uploads, so you can bring in existing spreadsheet data instead of retyping values. Canva offers more than 20 graph types and templates, allowing a line chart to share typography, color and layout with the rest of a branded design.
Publishing and distribution
Projects can be published, downloaded or embedded. That range covers static graphics for documents and social posts as well as web-based placement. A team can therefore use one chart design in several channels without rebuilding it from scratch.
Animation decision
The cited Canva material does not establish data-driven line-chart animation. Treat Canva as a design-led chart tool unless you separately confirm that the specific chart type and output you need support animation. This qualification matters if your brief calls for a time slider or a series that visibly progresses through dates.
Free tools Windows power users keep installed
One-click scans. No signup required.
Limits to plan for
- Spreadsheet import does not, by itself, prove that a chart will animate through periods.
- Templates can make a chart look consistent with a brand, but they do not replace a data-state control such as a time slider.
- Check the intended export before committing to a motion-heavy concept; the documented capabilities emphasize publishing, downloading and embedding rather than animated data playback.
4. Datawrapper: best for publishing and collaboration
Datawrapper is aimed at people who need a chart that is easy to publish, responsive across screen sizes and manageable by a team. Its documented feature set emphasizes the editorial and distribution pipeline rather than animated line-chart states.
What it does
The browser editor provides responsive previews so you can inspect how a chart behaves at different widths before publishing. Datawrapper supports embeds, PowerPoint output and print output, which helps the same chart move from a website to a briefing deck or printed report.
Brand and team controls
Custom themes let an organization standardize typography, colors and other presentation choices. Real-time collaboration supports shared production, useful when a reporter, analyst, designer and editor need to work on the same visualization.
Also popular on Amazon

- 【Large size】:Measuring 800 x 300 mm/ 31. 5×12 inches, which is wider and taller than others. Large mouse pad can perfectly fit your keyboard and mouse of any size, and there is also ample space for peripherals such as phones, tablets, etc.
- 【LED backlight mouse pad】:Blade Hawks RGB mouse pad provides 7 static modes and 7 dynamic modes will give you the options you are looking for. Power-off memory function remembers the last lighting mode you selected. The super glow fiber Chroma will give you a colorful gaming setup that you want.
- 【Anti-slip rubber base】:Made from Natural rubber, this gaming mousepad will firmly grip your desktop, allowing you to enjoy the ultimate precision in the games you are most passionate about. It also comes with a texture that enhances this ability even further.
- 【Smooth and waterproof surface】: Micro-textured cloth surface, for extremely precise mouse control and a smooth movement. When liquid splashes on the gaming mouse pad, it forms water droplets and slides down. Will not delay your work or gameplay.
- 【Plug and play】: This mouse and keyboard pad is powered by USB, plug and play, no driver required. One button control light modes. Press one time to change the lighting mode, press twice to change the brightness, press and hold about 3 seconds turn ON/OFF.
Where it fits
Choose Datawrapper for newsroom graphics, policy reports, business updates and other publication workflows where responsive embedding, repeatable themes and handoffs are more important than motion. It is particularly suitable when a chart must appear reliably in web and print contexts.
Limits to plan for
- The documented product material does not establish a specific animated line-chart workflow or time-slider control.
- PowerPoint and print outputs are valuable for static publication, but they should not be treated as evidence of interactive animation.
- If animation is a hard requirement, confirm the exact chart type and output behavior before selecting Datawrapper.
5. Infogram: best for interactive reports and dashboards
Infogram is a strong candidate when a line chart is one component of a larger interactive report or dashboard. Its official product information covers charts, reports, dashboards, embeds, data import, integrations and API capabilities.
What it does
You can combine imported data with other report elements and publish the result as an embedded interactive experience. Dashboard and report formats are useful when readers need several views—such as trend lines, totals and category breakdowns—in one place.
Data and integration workflow
Data import supports bringing existing material into a report, while integrations and API capabilities point to workflows that connect visualization projects with other systems. Those features make Infogram relevant to recurring reporting and stakeholder dashboards rather than one-off chart images.
Where it fits
Use Infogram for public-facing reports, campaign dashboards, educational data pages and internal views that combine multiple charts. Embedding allows the visualization to live inside another website or publication.
Quick wins for a faster PC:
Fix the driver behind crashes, sound loss and screen glitchesFind Drivers →Clear out junk files and repair common Windows errorsFree Scan →Scan for outdated or missing drivers - takes under a minuteDriver Scan →Limits to plan for
- The cited product page does not establish a specific animated line-chart workflow, time slider or transition setting.
- Interactive dashboards and embeds are not automatically animated; confirm the exact behavior of the line-chart component you plan to use.
- API and integration capabilities can support a connected workflow, but they may require more setup than a simple spreadsheet-to-chart project.
How do animated line chart makers differ?
The word “animated” covers two different experiences. A data-driven animation changes the chart’s values or visible time period; a presentation animation moves a chart object into view or advances it as part of a designed page. Decide which experience your audience needs before comparing products.
Data-driven time animation
Flourish is the clearest documented option in this group. Its time slider, row filters and step controls let a viewer move through periods and inspect how each series changes. This is appropriate for population trends, revenue by month, election results or any story where the sequence itself carries meaning.
Also popular on Amazon

- 【Softer and More Comfortable】Vaydeer wrist rest has unique diamond pattern, which is the combination of softness and aesthetics. The materials of wrist rest are improved into higher quality memory foam and covered with silky smooth lycra. The computer wrist rest makes you as comfortable and cushiony as like rest your wrists on clouds.
- 【Ergonomic Wrist Saver】The wrist rests for keyboard and mouse comes with a 17.32×3.15×0.83 inch keyboard wrist pad and a 5.94×3.15×0.83 inch mouse wrist support. Based on ergonomic design, the unique concave shape is the perfect fit for your wrist joints. The wrist rest pad fits most computer keyboards and laptops, improve hand and wrist posture, release your wrist and arm stress.
- 【Non-Slip Rubber Bottom】Featuring an anti-skid silicone base on the bottom, this wrist keyboard support stays firmly in place on your desk, preventing the padding from sliding around, ensuring stable and consistent wrist support during extended computer sessions.
- 【Better Experience & Pain Relief】Our keyboard arm rest is beneficial to alleviate the soreness caused by direct contact and friction between your arm and a hard desk surface, reducing the risk of wrist fatigue or carpal tunnel. The soft texture of memory foam can evenly distribute the pressure around your wrists and provide good support with just enough give.
- 【Helpful in Multiple Scenarios】Whether you're working, studying, writing, typing, gaming, this keyboard and mouse rest combo is an essential accessory to add comfort and support to your hands and wrists. It’s also a great gift for men, women, family, friend, coworker, gamer, teacher, etc.
Presentation-style motion
Visme’s animated charts are designed to sit inside presentations and infographics. The chart can be interactive in a published web page, but the downloadable MP4 and GIF versions are static. Canva may suit a branded visual treatment, but the cited material does not confirm data-driven animation.
Publication and dashboard interactivity
Datawrapper focuses on responsive publishing, themes and collaboration. Infogram focuses on reports, dashboards, embeds, imports, integrations and APIs. Both can make an interactive chart accessible on the web, yet neither product description here confirms a time-slider animation for line charts.
How do I choose the right animated line chart maker?
- Define the motion. Choose a data-state animation if viewers must move through dates. Choose presentation animation if the chart is one element in a slide or infographic.
- Choose the audience’s viewing context. A responsive embed or published URL suits readers on a website. A PowerPoint or print output suits briefings and reports. A downloadable MP4 or GIF is useful only when the chosen product preserves motion in that format.
- Check your data shape. Flourish supports wide and long layouts, with long format recommended for multiple animated lines. Canva accepts XLSX, CSV and TSV uploads. Other tools in this comparison emphasize import or browser editing without documenting the same animation-specific structure.
- List the interaction you need. Time sliders, row or series filters, popups, hover details, annotations, forecasts and stories point toward Flourish. Embedded reports and dashboards point toward Infogram. Responsive previews, themes and team editing point toward Datawrapper.
- Match branding requirements. Canva’s templates and spreadsheet imports are suited to design-led consistency. Datawrapper’s custom themes provide repeatable publication styling. Visme places the chart inside a broader presentation or infographic canvas.
- Decide whether a static fallback is acceptable. If some viewers will receive an image, printout or downloaded file, plan a readable static version. Visme’s documented MP4 and GIF downloads are static, and other tools may also have output-specific limitations.
- Plan the distribution path before building. Confirm whether the final destination is a published URL, responsive embed, HTML5 package, PowerPoint file, print page, image, GIF or MP4. Output requirements can eliminate a tool even when its editor looks suitable.
How do I make a data-driven animated line chart in Flourish?
Prepare the table first, then connect the time control to the correct field. The following workflow follows Flourish’s documented wide- and long-format options.
- Choose a data layout. For one animated series or a simple period structure, use wide format with one X-axis column and separate columns for each period or series. For more than one line that must animate by period, use long format with an X-axis column, a value column and a period column.
- Import the table into a line-chart project. Confirm that dates or category labels are in the X-axis field and that numeric values are in the value fields. Keep period labels consistent so the control can order them correctly.
- Add the time control. Select a time-slider control for wide-format data. With long-format data, bind a row filter to a time slider so the period field drives the visible state.
- Set the animation behavior. Adjust step timing, enable or disable animation, and choose how colors behave as the chart advances. If changing scales could mislead viewers, set fixed Y-axis minimum and maximum values.
- Add explanatory interaction. Use filters, popups, legends, annotations or small multiples when they clarify comparisons. Add forecasts or projections only when the distinction between observed and projected values is clear.
- Build a story when sequence matters. Multi-step stories can guide readers through selected states instead of asking them to discover every pattern themselves.
- Publish or embed the result. Use a published URL or responsive embed for an interactive audience. Keep a static interpretation of the chart available for contexts that cannot run the interactive version.
How we picked these chart makers
The ranking prioritizes documented support for data-driven animation, then weighs interactivity, output and distribution, data workflow, branding and collaboration. Flourish leads because its line-chart documentation explicitly covers animated states and time sliders. Visme follows for documented animated and interactive charts in web-oriented outputs. Canva, Datawrapper and Infogram are ranked for their strongest established workflows—design, publishing and reporting—without treating general interactivity as proof of animated line-chart behavior.
Frequently Asked Questions
Can I embed an animated line chart on my website?
Yes. Flourish supports published URLs and responsive embeds, while Visme preserves chart animation in published URLs, embeds and HTML5. Datawrapper and Infogram also emphasize embeds, although their cited product information does not confirm a data-driven animation workflow.
Can I export an animated line chart to MP4 or GIF?
Visme’s help documentation specifies that MP4 and GIF downloads are static, even though its published and embedded charts remain animated. For a moving data timeline, an interactive web output is therefore safer than assuming a downloadable video retains motion.
Which tool is easiest for a spreadsheet with several animated lines?
Flourish recommends long-format data for animating more than one line: an X-axis column, a value column and a period column. That structure lets a row filter and time slider control the visible period across series.
Also popular on Amazon

- 【No Drill Mounted】Cable management tray can be assembled in as little as 3 minutes or less-simply. Side clips easily clampe the edge of desk, pass through the holes on the sides, and secure excess cables with baskets. Desk cable management supports inward or outward installation to meet your needs in different scenarios, and provides you with great convenience when collecting and organizing wires.
- 【Rubber Pad Protects Desk】Wire organizer under desk built-in soft rubber pads on the clamp protect your desk from scratches, so you will not damage your furniture or office.
- 【Sturdy and Beautiful】Cord management under desk is made of high-quality carbon steel and holds about 15 lbs. The wire basket has 2 holes on each side of the tray to enable your cables to pass freely. Cable baskets are suitable for desk thickness use from 0.4" to 2.4".
- 【Space Saving & Keep Organized】Desk cable management tray holds all your power cords, outlet strips, USB hubs and computer transformers hidden from your feet, and the data cables will not enter the vacuum cleaner to keep your desk clean and tidy. Desk wire organizer is also suitable for use in the kitchen and outdoors.
- 【Reduce Safety Risks】Cable tray under desk keeps all plugs away from your kids, no more worry about tripping. Using 2 holes wire tray saves extra space, helps you easily cabling and wire protection. The mesh design is not easy to accumulate dust, but avoids safety accidents caused by messy wires.
What is the best chart maker for a presentation?
Visme is the strongest fit when the chart must share a canvas with text, graphics and other presentation elements. Canva is a good alternative when brand templates and spreadsheet imports matter more than confirmed data-driven animation.
Do I need coding experience to animate a line chart?
No-code workflows are available. Flourish explicitly positions its animated line charts as code-free, and the other products here provide visual editors or design interfaces for their respective chart and report workflows.
Frequently Asked Questions
Can I embed an animated line chart on my website?
Yes. Flourish supports published URLs and responsive embeds, while Visme preserves chart animation in published URLs, embeds and HTML5. Datawrapper and Infogram also emphasize embeds, although their cited product information does not confirm a data-driven animation workflow.
Can I export an animated line chart to MP4 or GIF?
Visme’s help documentation specifies that MP4 and GIF downloads are static, even though its published and embedded charts remain animated. For a moving data timeline, an interactive web output is therefore safer than assuming a downloadable video retains motion.
Which tool is easiest for a spreadsheet with several animated lines?
Flourish recommends long-format data for animating more than one line: an X-axis column, a value column and a period column. That structure lets a row filter and time slider control the visible period across series.
What is the best chart maker for a presentation?
Visme is the strongest fit when the chart must share a canvas with text, graphics and other presentation elements. Canva is a good alternative when brand templates and spreadsheet imports matter more than confirmed data-driven animation.
Do I need coding experience to animate a line chart?
No-code workflows are available. Flourish explicitly positions its animated line charts as code-free, and the other products here provide visual editors or design interfaces for their respective chart and report workflows.
Do these 3 things before closing this tab:
1Clear out junk files and repair common Windows errors2Scan for outdated or missing drivers - takes under a minute3Repair Windows errors before they cause bigger problemsQuick Recap
Product prices and availability are accurate as of the date/time indicated and are subject to change. Any price and availability information displayed on Amazon at the time of purchase will apply.

