
Storyline JS
Storyline JS: A focused open-source tool for annotated, embeddable time-series line-chart stories. Ranked #14 of 22 in Data Storytelling Tools by our editors (7.6/10); pricing: Free plan; best for developers making annotated line-chart stories.
At a glance
- Editor score7.6 / 10
- PricingFree plan
- Best forDevelopers making annotated line-chart stories
- Free planYes
- Paid fromFree
- Interactive visualizationsYes
- Founded2017 · Evanston, Illinois, United States
- Facts checked20 Sep 2026
Where it wins
- Annotated interactive charts connect narrative cards to data points
- Google Sheets input simplifies time-series data preparation
- JavaScript, CSS, and embed support suit web publishing workflows
Where it doesn't
- Its narrow focus does not cover many other chart types
- Sharing centers on embedded visualizations for websites and blogs
- Developer integration requires JavaScript and CSS familiarity
Our verdict on Storyline JS
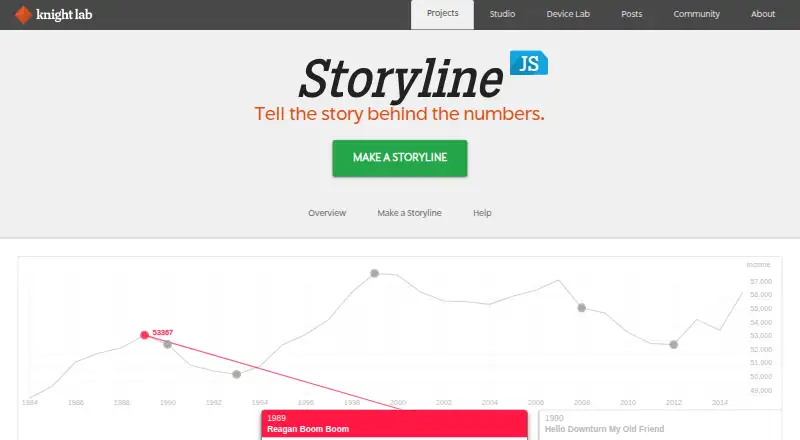
Storyline JS is an open-source web tool for creating annotated, interactive line charts from time-series data. It is designed for journalists, storytellers, and developers who need to explain trends through a focused visual narrative rather than build a full charting experience from scratch. Users can bring in data from Google Sheets, attach narrative cards to individual data points, configure chart and date-display settings, and present the result in a mobile-oriented format.
Its strongest fit is the combination of narrative structure and web publishing. Storyline JS turns a time-series chart into a presentation with annotations attached to the underlying data, helping readers follow how a trend develops. The output can be embedded in websites and blogs, while JavaScript and CSS integration gives developers a direct path to incorporating the library into a broader web project. Google Sheets input also supports a workflow in which data preparation and story content are managed separately from the published visualization.
The trade-off is focus. Storyline JS is built around annotated interactive line charts, so teams seeking a broader data-storytelling system with varied chart types or more expansive publishing options may need another tool. Its sharing model is centered on embeds, making it a better choice for web pages and blog posts than for a general-purpose presentation or dashboard workflow. Choose it when the story depends on explaining change over time with narrative annotations; look elsewhere when you need broad visualization coverage or a less developer-oriented integration path.
Your product? Our editors can test Storyline JS in depth and publish a review, labelled as paid · from $149/mo →
Storyline JS pricing
Storyline JS fact sheet
| Free plan | Yes |
|---|---|
| Paid from | Free |
| Interactive visualizations | Yes |
| Narrative annotations | Yes |
| Presentation flow | Yes |
| Live data refresh | Not verified |
| Share mode | Embed |
| Data source limit | Not verified |
| Deployment | Cloud, Self-hosted |
| Platforms | Web |
| Support | Email, Community, Docs |
| Built for | Solo, Small business (editorial estimate) |
| Integrations | 1 integrations: Google Sheets |
| Pricing | Free plan |
| Website | storyline.knightlab.com |
| Facts checked | 20 Sep 2026 |
Storyline JS integrations
Storyline JS lists 1 integrations on its own site.
- Google Sheets
Alternatives to Storyline JS
- FlourishA flexible browser-based toolkit for interactive charts, maps and scrollytelling.9.3
- DatawrapperA versatile choice for interactive data publishing, collaboration, and newsroom-ready exports.9.1
- InfogramA broad web-based toolkit for branded, interactive reports and infographics.9.0



See all Storyline JS alternatives →
Used Storyline JS? Be the first to review it
The editor score above is our own research. What this page doesn't have yet is a reader's view — what you used Storyline JS for, what worked and what didn't. No stars are seeded and no review is paid for; an editor reads every one before it appears.
Write a reviewTwo minutes · verified accounts only · read by an editor before it appears
Featured on iTechGuides

Storyline JS is listed in our Data Storytelling Tools directory. Add the badge to your site — it links back to this page.
<a href="https://www.itechguides.com/products/storyline-js/"><img src="https://www.itechguides.com/best/badge/storyline-js.svg" alt="Featured on iTechGuides" width="230" height="46"></a>
Reviewed by iTechGuides Editors · Editorial team · Updated Oct 2026
Advertiser disclosure: iTechGuides is reader-supported. Vendors can pay for top positions in our rankings and for a place on other products' pages, and we may earn a commission when you click some links. Bought places stand at the number bought; this page and our disclosure say so. Paying vendors may get a fuller, more detailed review from our editors, and that review can change their score. How we rank.
Last updated · How we research and update