pwru
pwru: A focused Linux utility for tracing packets through kernel networking paths. Ranked #27 of 29 in eBPF Observability Tools by our editors (6.5/10); pricing: Open source; best for low-level Linux packet tracing.
At a glance
- Editor score6.5 / 10
- PricingOpen source
- Best forLow-level Linux packet tracing
- Paid fromFree
- Deployment modelSelf-hosted
- Facts checked22 Sep 2026
Where it wins
- Filters packets with PCAP, kernel functions, namespaces, and interfaces
- Shows packet metadata, stacks, tuples, tunnels, TCP flags, and SKB output
- Supports JSON traces, rotating files, Docker, and Kubernetes-node execution
Where it doesn't
- Linux-only deployment limits use on other operating systems
- Self-hosted operation requires host-level deployment and administration
- Does not provide application tracing or kernel profiling
Our verdict on pwru
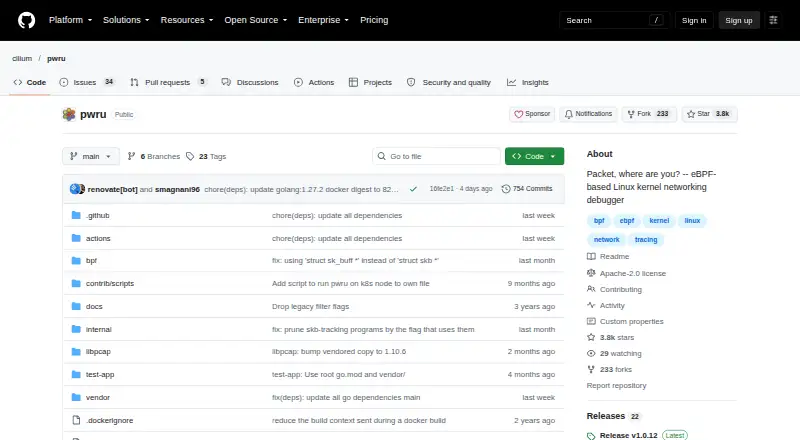
pwru is an open-source command-line utility for tracing network packets through the Linux kernel with eBPF. It is designed for engineers debugging connectivity and networking behavior at host level, particularly when packet paths, kernel functions, namespaces, interfaces, TC programs, or XDP programs need closer inspection. Its focus is Linux network visibility rather than general application observability, and it runs as a self-hosted tool rather than a hosted service.
The strongest part of pwru is its filtering and output depth. PCAP-based packet filtering can narrow investigations to relevant traffic, while kernel-function filters support exact or regular-expression matching. Network-namespace and interface filters add further control. Traces can include packet metadata, tuples, stacks, tunnel details, TCP flags, and SKB information. JSON output and rotating trace files support structured analysis and longer-running capture workflows. Docker execution and deployment as a privileged Kubernetes pod on a node extend the tool to containerized environments.
pwru is a strong choice for Linux specialists who need detailed packet-level and kernel-path visibility without adopting a broad observability platform. Its narrow scope is also the main boundary: it is not intended for application tracing or kernel profiling, and Linux is the supported operating system. Teams seeking a hosted service, cross-platform coverage, or application-level telemetry should choose a product built around those requirements instead. For host-level Linux networking diagnosis, pwru offers a concentrated feature set centered on tracing where packets move and how the kernel handles them.
Your product? Our editors can test pwru in depth and publish a review, labelled as paid · from $149/mo →
pwru pricing
pwru fact sheet
| Free plan | Not verified |
|---|---|
| Paid from | Free |
| Deployment model | Self-hosted |
| Kubernetes support | Yes |
| Network visibility | Yes |
| Application tracing | No |
| Kernel profiling | No |
| Supported operating systems | Linux |
| Deployment | Self-hosted |
| Platforms | Linux |
| Support | Community, Docs |
| Built for | Solo, Small business, Mid-market, Enterprise (editorial estimate) |
| Pricing | Open source |
| Website | github.com |
| Facts checked | 22 Sep 2026 |
Alternatives to pwru
- CorootBroad eBPF observability with a free edition and $1-per-core Standard pricing.9.3
- DeepFlowA broad open-source platform for application, network, and system observability.9.1
- groundcoverA broad eBPF observability platform for teams connecting traces, RUM, logs, and metrics.9.0



Used pwru? Be the first to review it
The editor score above is our own research. What this page doesn't have yet is a reader's view — what you used pwru for, what worked and what didn't. No stars are seeded and no review is paid for; an editor reads every one before it appears.
Write a reviewTwo minutes · verified accounts only · read by an editor before it appears
Featured on iTechGuides

pwru is listed in our eBPF Observability Tools directory. Add the badge to your site — it links back to this page.
<a href="https://www.itechguides.com/products/pwru/"><img src="https://www.itechguides.com/best/badge/pwru.svg" alt="Featured on iTechGuides" width="230" height="46"></a>
Reviewed by iTechGuides Editors · Editorial team · Updated Oct 2026
Advertiser disclosure: iTechGuides is reader-supported. Vendors can pay for top positions in our rankings and for a place on other products' pages, and we may earn a commission when you click some links. Bought places stand at the number bought; this page and our disclosure say so. Paying vendors may get a fuller, more detailed review from our editors, and that review can change their score. How we rank.
Last updated · How we research and update