
Perses
Perses: A self-hosted visualization layer for Kubernetes metrics, traces, logs, and profiles. Ranked #43 of 53 in Kubernetes Monitoring by our editors (4.8/10); pricing: Free plan; best for self-hosted teams building Kubernetes dashboards.
At a glance
- Editor score4.8 / 10
- PricingFree plan
- Best forSelf-hosted teams building Kubernetes dashboards
- Free planYes
- Paid fromFree
- Facts checked20 Sep 2026
Where it wins
- Prometheus, Tempo, Loki, and profile visualization in one layer
- Dashboard-as-code with SDKs, CLI workflows, and static validation
- Kubernetes operator, datasource discovery, OIDC/OAuth, and RBAC
Where it doesn't
- Primarily visualizes observability data rather than collecting or retaining it
- Requires connected observability backends for metrics, traces, logs, or profiles
- Kubernetes-focused workflows may be broader than needed for simple dashboards
Our verdict on Perses
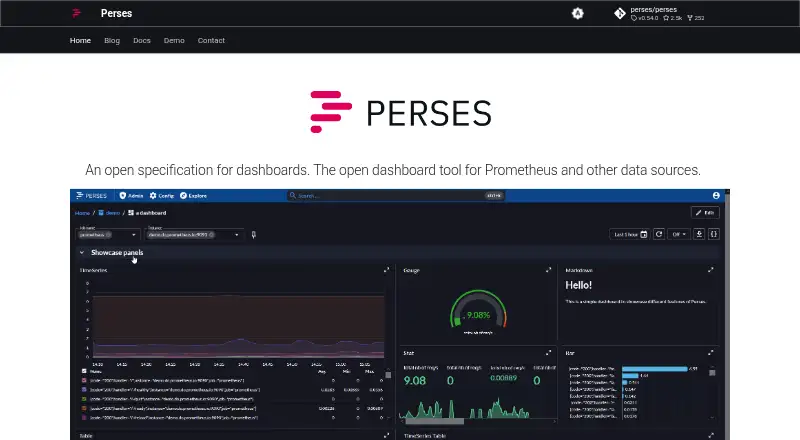
Perses is an open-source dashboard and visualization tool for teams operating Kubernetes and cloud-native environments. It provides a self-hosted layer for exploring Prometheus metrics, Tempo traces, Loki logs, and profiling data through dashboards and explorer views. Its Kubernetes operator, custom resources, datasource discovery, and Kubernetes-inspired RBAC make it a fit for teams building dashboards around Kubernetes operations. Web, API, and self-hosted deployments are supported, and Grafana dashboard migration is included.
The strongest case for Perses is its developer-oriented dashboard workflow. Teams can manage dashboards as code with SDKs, validate them statically with extensible lint rules, and use the CLI for API and CI/CD workflows. Kubernetes custom resources extend that approach into cluster management. Datasource discovery can use HTTP services or the Kubernetes API, while integrations include Prometheus, Alertmanager, Tempo, Jaeger, Loki, VictoriaLogs, OpenSearch, ClickHouse, GreptimeDB, Pyroscope, and Splunk. Trace views include scatter plots, Gantt charts, and tables, and log views support search and filtering.
Perses should suit teams that want an open-source, self-hosted visualization layer with Kubernetes-native management and repeatable dashboard delivery. OIDC/OAuth authentication and RBAC support access control, while embeddable components and plugin extensibility support broader dashboard use. The trade-off is scope: Perses is primarily a visualization and dashboard layer, with observability backends providing the connected data. Teams seeking native data collection or retention should choose a product designed around those responsibilities instead. For Kubernetes operators standardizing dashboards across metrics, traces, logs, and profiles, Perses offers a focused foundation rather than a complete monitoring system.
Your product? Our editors can test Perses in depth and publish a review, labelled as paid · from $149/mo →
Perses pricing
Perses fact sheet
| Free plan | Yes |
|---|---|
| Paid from | Free |
| Control-plane monitoring | Not verified |
| Kubernetes logs | Not verified |
| Distributed tracing | Yes |
| Alerting channels | Not verified |
| Managed Kubernetes support | Not verified |
| Data retention | Not verified |
| Deployment | Self-hosted |
| Platforms | Web |
| Support | Email, Community, Docs |
| Built for | Small business, Mid-market, Enterprise (editorial estimate) |
| Integrations | 11 integrations: ClickHouse, GreptimeDB, Loki, OpenSearch, Prometheus, Pyroscope … |
| Pricing | Free plan |
| Website | perses.dev |
| Facts checked | 20 Sep 2026 |
Perses integrations
Perses lists 11 integrations on its own site.
- ClickHouse
- GreptimeDB
- Loki
- OpenSearch
- Prometheus
- Pyroscope
- Tempo
- VictoriaLogs
- Alertmanager
- Jaeger
- Splunk
Alternatives to Perses
- Datadog Kubernetes MonitoringA broad Kubernetes observability platform for teams managing complex cloud-native environments.9.3
- PrometheusA strong open-source choice for Kubernetes metrics, with PromQL and flexible collection.9.1
- AppDynamics Kubernetes MonitoringA broad Kubernetes and OpenShift monitoring suite for enterprise operations teams.8.9



Used Perses? Be the first to review it
The editor score above is our own research. What this page doesn't have yet is a reader's view — what you used Perses for, what worked and what didn't. No stars are seeded and no review is paid for; an editor reads every one before it appears.
Write a reviewTwo minutes · verified accounts only · read by an editor before it appears
Featured on iTechGuides

Perses is listed in our Kubernetes Monitoring directory. Add the badge to your site — it links back to this page.
<a href="https://www.itechguides.com/products/perses/"><img src="https://www.itechguides.com/best/badge/perses.svg" alt="Featured on iTechGuides" width="230" height="46"></a>
Reviewed by iTechGuides Editors · Editorial team · Updated Oct 2026
Advertiser disclosure: iTechGuides is reader-supported. Vendors can pay for top positions in our rankings and for a place on other products' pages, and we may earn a commission when you click some links. Bought places stand at the number bought; this page and our disclosure say so. Paying vendors may get a fuller, more detailed review from our editors, and that review can change their score. How we rank.
Last updated · How we research and update