OpenTelemetry eBPF Profiler
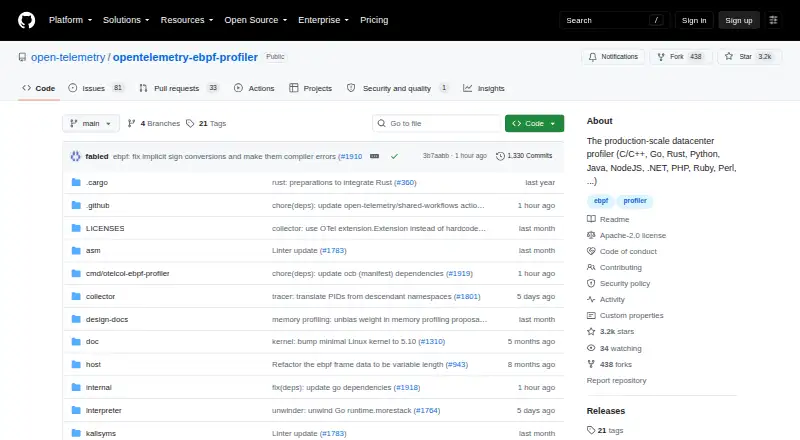
OpenTelemetry eBPF Profiler: A broad, open-source profiler for engineers tracing mixed-language systems on Linux. Ranked #15 of 29 in Continuous Profiling Tools by our editors (7.5/10); pricing: Open source; best for engineers needing whole-system, cross-language profiling.
At a glance
- Editor score7.5 / 10
- PricingOpen source
- Best forEngineers needing whole-system, cross-language profiling
- Paid fromFree
- DeploymentSelf-hosted
- Facts checked20 Sep 2026
Where it wins
- Profiles whole systems across kernel, libraries, and application runtimes
- Supports native code plus JVM, Python, Ruby, PHP, Node.js, and .NET
- Outputs OpenTelemetry Profiles and integrates with the Collector
Where it doesn't
- Requires Linux and a self-hosted deployment model
- OpenTelemetry Profiles output is still Alpha and evolving
- Mature production-ready backends have not yet emerged
Our verdict on OpenTelemetry eBPF Profiler
OpenTelemetry eBPF Profiler is an open-source, whole-system profiler for Linux. It uses eBPF to collect cross-language stack traces across kernel space, system libraries, native applications, and high-level language runtimes. The supported scope includes C/C++, Rust, Zig, Go, HotSpot JVM, Python, Ruby, PHP, Node.js, V8, Perl, Erlang, and .NET. It is aimed at engineers who need visibility across an entire mixed-language system rather than profiling a single application runtime. The profiler can collect data without application instrumentation, reconfiguration, or restarts.
Its main strength is breadth across profiling layers. It supports native inline frames, ARM64 unwinders, and system-library profiling without frame pointers or host debug symbols. That makes it suited to investigating mixed stacks that cross from kernel space into higher-level languages. The OpenTelemetry Collector receiver integration adds a path into OpenTelemetry-based pipelines, while integrations with Pyroscope and devfiler extend its ecosystem fit. The project is described for development and production-scale datacenter profiling, but the Linux and self-hosted model places deployment responsibility with the engineering team.
The key consideration is the maturity of the Profiles ecosystem. OpenTelemetry Profiles output is Alpha and evolving, and mature production-ready backends have not yet emerged. Teams that want whole-system, cross-language coverage and can operate Linux infrastructure should find the feature scope compelling. Teams seeking a managed service, broader platform coverage, or a mature backend experience should consider an alternative. OpenTelemetry eBPF Profiler is therefore a focused choice for engineers who value comprehensive system visibility and OpenTelemetry alignment over deployment convenience.
Your product? Our editors can test OpenTelemetry eBPF Profiler in depth and publish a review, labelled as paid · from $149/mo →
OpenTelemetry eBPF Profiler pricing
OpenTelemetry eBPF Profiler fact sheet
| Free plan | Not verified |
|---|---|
| Paid from | Free |
| Deployment | Self-hosted |
| Language support | C/C++, Rust, Zig, Go, HotSpot JVM, Python, Ruby, PHP, Node.js, V8, Perl, Erlang, .NET |
| Profiling types | whole-system, cross-language, native code, system libraries, high-level language runtimes |
| Data retention | Not verified |
| Source map support | Not verified |
| Continuous alerts | Not verified |
| Deployment | Self-hosted |
| Platforms | Linux |
| Support | Community, Docs |
| Built for | Mid-market, Enterprise (editorial estimate) |
| Integrations | 3 integrations: OpenTelemetry Collector, Pyroscope, devfiler |
| Pricing | Open source |
| Website | github.com |
| Facts checked | 20 Sep 2026 |
OpenTelemetry eBPF Profiler integrations
OpenTelemetry eBPF Profiler lists 3 integrations on its own site.
- OpenTelemetry Collector
- Pyroscope
- devfiler
Alternatives to OpenTelemetry eBPF Profiler
- PyroscopeA versatile profiler with open-source flexibility, hosted plans, and Grafana integration.9.3
- Datadog Continuous ProfilerBroad production profiling with Datadog integrations, starting at $19 per host monthly.9.2
- Google Cloud ProfilerFree production profiling with strong analysis tools for four supported languages.9.1



See all OpenTelemetry eBPF Profiler alternatives →
Used OpenTelemetry eBPF Profiler? Be the first to review it
The editor score above is our own research. What this page doesn't have yet is a reader's view — what you used OpenTelemetry eBPF Profiler for, what worked and what didn't. No stars are seeded and no review is paid for; an editor reads every one before it appears.
Write a reviewTwo minutes · verified accounts only · read by an editor before it appears
Featured on iTechGuides

OpenTelemetry eBPF Profiler is listed in our Continuous Profiling Tools directory. Add the badge to your site — it links back to this page.
<a href="https://www.itechguides.com/products/opentelemetry-ebpf-profiler/"><img src="https://www.itechguides.com/best/badge/opentelemetry-ebpf-profiler.svg" alt="Featured on iTechGuides" width="230" height="46"></a>
Reviewed by iTechGuides Editors · Editorial team · Updated Oct 2026
Advertiser disclosure: iTechGuides is reader-supported. Vendors can pay for top positions in our rankings and for a place on other products' pages, and we may earn a commission when you click some links. Bought places stand at the number bought; this page and our disclosure say so. Paying vendors may get a fuller, more detailed review from our editors, and that review can change their score. How we rank.
Last updated · How we research and update