
Odigos
Odigos: OpenTelemetry-first observability for traces, metrics, logs, and profiling across varied infrastructure. Ranked #4 of 29 in eBPF Observability Tools by our editors (8.9/10); pricing: Free plan · 14-day trial; best for openTelemetry-first instrumentation.
At a glance
- Editor score8.9 / 10
- PricingFree plan · 14-day trial
- Best forOpenTelemetry-first instrumentation
- Free planYes
- Deployment modelSelf-hosted
- Facts checked22 Sep 2026
Where it wins
- Automatic traces, metrics, and logs without modifying application code
- Supports Kubernetes, VMs, and bare-metal Linux deployments
- Exports OpenTelemetry data to major managed and self-hosted backends
Where it doesn't
- Enterprise pricing is contact-sales and custom
- Advanced eBPF visibility is positioned in the Enterprise plan
- Self-hosted deployment requires infrastructure management
Our verdict on Odigos
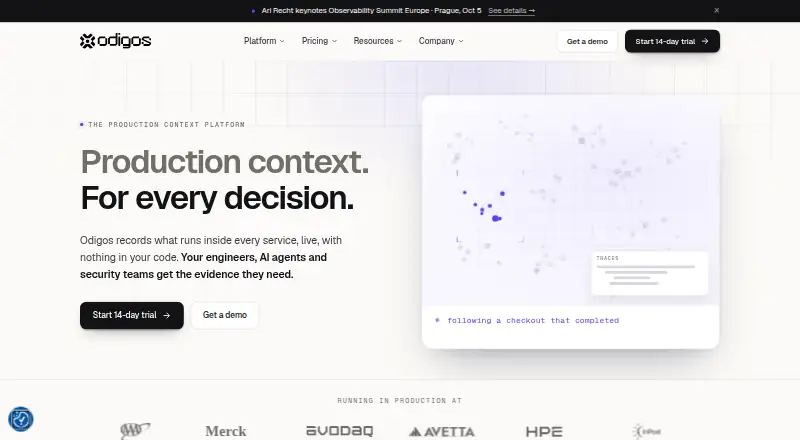
Odigos is a self-hosted observability platform for teams running services across Kubernetes, virtual machines, and bare-metal Linux environments. It automatically instruments applications for traces, metrics, and logs, then routes telemetry through OpenTelemetry to managed or self-hosted destinations. Its eBPF capabilities can capture application functions, arguments, return values, and call stacks without modifying application code. The product is suited to organizations that want OpenTelemetry-first instrumentation with Kubernetes attributes, service graph metrics, network visibility, and continuous CPU profiling.
The Open Source plan is Apache 2.0, self-hosted, and includes core OpenTelemetry tracing. A 14-day free trial is listed, while the Enterprise plan uses contact-sales, custom pricing. Enterprise adds low-overhead eBPF capture, database extended distributed tracing, multi-cluster administration, and 24/7 premium support. Sampling and telemetry processing actions are available for managing collected data. Teams should choose the Open Source plan when core tracing and self-hosted operation meet their needs; Enterprise is the clearer fit for broader application visibility, database tracing, and multi-cluster administration.
Odigos connects with Datadog, Grafana, Splunk, Jaeger, Tempo, Loki, New Relic, Dynatrace, Elastic APM, AWS CloudWatch, AWS X-Ray, Azure Monitor, Google Cloud Monitoring, ClickHouse, and Elasticsearch. This gives teams flexibility to send OpenTelemetry data to existing observability systems rather than adopting a single destination. Its scope spans application instrumentation, profiling, network flow, TCP statistics, and service graph metrics. Teams seeking a fully managed observability service or a tool focused only on a narrow signal may prefer an alternative; Odigos is better aligned with organizations prepared to operate a self-hosted, OpenTelemetry-centered platform.
Your product? Our editors can test Odigos in depth and publish a review, labelled as paid · from $149/mo →
Odigos pricing
All 2 Odigos plans and prices →
Odigos fact sheet
| Free plan | Yes |
|---|---|
| Paid from | Not verified |
| Deployment model | Self-hosted |
| Kubernetes support | Yes |
| Network visibility | Yes |
| Application tracing | Yes |
| Kernel profiling | Yes |
| Supported operating systems | Linux |
| Free trial | 14 days · no card needed |
| Deployment | Self-hosted |
| Platforms | Windows, macOS, Linux |
| Compliance & security | SOC 2 |
| Support | Community, Docs · 24/7 |
| Built for | Small business, Mid-market, Enterprise (editorial estimate) |
| Integrations | 15 integrations: Datadog, Grafana, Splunk, Jaeger, Tempo, Loki … See all → |
| Pricing | Free plan · 14-day trial (source) |
| Website | odigos.io |
| Facts checked | 22 Sep 2026 |
Odigos integrations
Odigos lists 15 integrations on its own site.
- Datadog
- Grafana
- Splunk
- Jaeger
- Tempo
- Loki
- New Relic
- Dynatrace
- Elastic APM
- AWS CloudWatch
- AWS X-Ray
- Azure Monitor
- Google Cloud Monitoring
- ClickHouse
- Elasticsearch
Alternatives to Odigos
- CorootBroad eBPF observability with a free edition and $1-per-core Standard pricing.9.3
- DeepFlowA broad open-source platform for application, network, and system observability.9.1
- groundcoverA broad eBPF observability platform for teams connecting traces, RUM, logs, and metrics.9.0



Odigos vs the competition
- Odigos vs Coroot
- Odigos vs DeepFlow
- Odigos vs groundcover
- Odigos vs KubeSense
- Odigos vs ApexData
- Odigos vs Gyeeta


Compare Odigos with any tool side by side →
Also Ranked In
Odigos is ranked in 2 of our directories.
Used Odigos? Be the first to review it
The editor score above is our own research. What this page doesn't have yet is a reader's view — what you used Odigos for, what worked and what didn't. No stars are seeded and no review is paid for; an editor reads every one before it appears.
Write a reviewTwo minutes · verified accounts only · read by an editor before it appears
Featured on iTechGuides
Odigos is listed in our eBPF Observability Tools directory. Add the badge to your site — it links back to this page.
<a href="https://www.itechguides.com/products/odigos/"><img src="https://www.itechguides.com/best/badge/odigos.svg" alt="Featured on iTechGuides" width="230" height="46"></a>
Reviewed by iTechGuides Editors · Editorial team · Updated Oct 2026
Advertiser disclosure: iTechGuides is reader-supported. Vendors can pay for top positions in our rankings and for a place on other products' pages, and we may earn a commission when you click some links. Bought places stand at the number bought; this page and our disclosure say so. Paying vendors may get a fuller, more detailed review from our editors, and that review can change their score. How we rank.
Last updated · How we research and update