iotop
iotop: A focused, free Linux utility for diagnosing local process and thread I/O load. Ranked #26 of 26 in Process Monitoring Software by our editors (6.7/10); pricing: Free plan; best for linux administrators focused on process I/O.
At a glance
- Editor score6.7 / 10
- PricingFree plan
- Best forLinux administrators focused on process I/O
- Free planYes
- Paid fromFree
- Remote monitoringNo
- Facts checked21 Sep 2026
Where it wins
- Detailed process and thread I/O views with bandwidth, wait, and swap metrics
- Filters by process, thread, user, or regular expression
- Batch logging, graphs, sorting, and interactive ionice adjustment
Where it doesn't
- Linux-only and designed for local machines or servers
- No documented remote or service monitoring
- No documented alerting for threshold-based notification
Our verdict on iotop
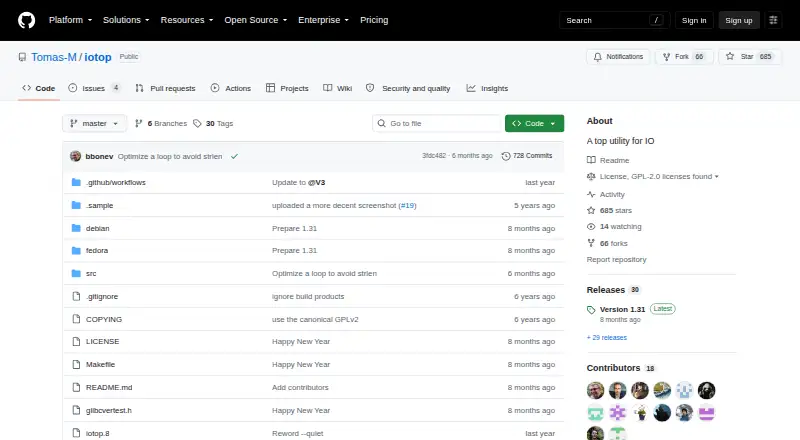
iotop is an open-source, terminal-based Linux utility for administrators and users diagnosing high input/output load on local machines or servers. It displays current process and thread activity, including disk-read and disk-write bandwidth, I/O-wait and swap-in percentages, priorities, command lines, and accumulated I/O. Interactive and batch modes support both live investigation and output logging over time. The product is best suited to Linux users who want detailed process-level visibility from the command line rather than a hosted monitoring interface.
Its strongest area is focused I/O analysis. Users can filter by process, thread, user, or regular expression, then sort and customize columns, units, colors, and graphs to narrow attention to the activity that matters. Accumulated I/O and bandwidth views add context beyond a single moment, while batch output can support repeated observation or log collection. Interactive I/O-priority adjustment through ionice extends the utility from diagnosis into a direct process-management workflow. That combination makes it a practical fit for investigating local disk pressure and identifying which processes are contributing to it.
iotop is less suitable when monitoring must extend beyond one Linux environment or include broader operational workflows. The published capabilities cover local process and thread activity, while remote monitoring, service monitoring, and alerting are outside its documented scope. It also remains a command-line utility rather than a hosted service, so teams seeking centralized visibility or notification workflows should choose a different category of tool. Pick iotop for free, focused Linux I/O inspection and process-level troubleshooting; look elsewhere for cross-platform coverage, remote fleet monitoring, service health checks, or alert-driven operations.
Your product? Our editors can test iotop in depth and publish a review, labelled as paid · from $149/mo →
iotop pricing
iotop fact sheet
| Free plan | Yes |
|---|---|
| Paid from | Free |
| Supported platforms | Linux |
| Remote monitoring | No |
| Service monitoring | No |
| Process alerting | No |
| History retention | Not verified |
| Process controls | Yes |
| Activity logs | Yes |
| Deployment | Self-hosted |
| Platforms | Linux |
| Support | Community, Docs |
| Built for | Solo, Small business, Mid-market, Enterprise (editorial estimate) |
| Pricing | Free plan |
| Website | github.com |
| Facts checked | 21 Sep 2026 |
Alternatives to iotop
- GlancesA broad, free monitoring toolkit for cross-platform and self-hosted infrastructure.9.4
- PM2A capable Node.js process manager with deeper monitoring in paid tiers.9.2
- MonitA focused self-hosted monitor for service health, system checks, and automatic recovery.9.1



Used iotop? Be the first to review it
The editor score above is our own research. What this page doesn't have yet is a reader's view — what you used iotop for, what worked and what didn't. No stars are seeded and no review is paid for; an editor reads every one before it appears.
Write a reviewTwo minutes · verified accounts only · read by an editor before it appears
Featured on iTechGuides

iotop is listed in our Process Monitoring Software directory. Add the badge to your site — it links back to this page.
<a href="https://www.itechguides.com/products/iotop/"><img src="https://www.itechguides.com/best/badge/iotop.svg" alt="Featured on iTechGuides" width="230" height="46"></a>
Reviewed by iTechGuides Editors · Editorial team · Updated Oct 2026
Advertiser disclosure: iTechGuides is reader-supported. Vendors can pay for top positions in our rankings and for a place on other products' pages, and we may earn a commission when you click some links. Bought places stand at the number bought; this page and our disclosure say so. Paying vendors may get a fuller, more detailed review from our editors, and that review can change their score. How we rank.
Last updated · How we research and update