
Recommended Free Tools
Windows 11 can show your GPU temperature in Task Manager when the GPU and its driver expose the required sensor data, but Task Manager does not provide a general CPU-temperature reading. For CPU temperatures, use UEFI/BIOS for a pre-boot check or a hardware-monitoring tool such as HWiNFO or Core Temp.
The best method depends on what you need: Task Manager is convenient for a quick GPU check, while HWiNFO is the more complete option for monitoring CPU cores, GPU temperatures, hotspots, fans, and other sensors.
Check GPU temperature with Task Manager
Task Manager can display a GPU temperature in degrees Celsius when the graphics hardware and driver expose the required sensor data. The reading is not a complete hardware-sensor dashboard: it generally does not show every sensor, such as GPU hotspot, memory-junction, or VRM temperatures.
- Press Ctrl + Shift + Esc to open Task Manager. Alternatively, right-click the Start button and select Task Manager.
- If Task Manager opens in its compact view, select More details.
- Select Performance.
- Select GPU 0, GPU 1, or the GPU you want to check.
- Read the temperature in the GPU details pane.
A temperature may also appear beside the GPU in the left-hand list. The detailed GPU page is the better place to check because it provides more information and is less affected by display-layout issues.
#1 Best Overall

- Screen Stand Installation Guide: Please ensure that you use the (H) Screws specified in the instruction manual when installing the Screen Stand and the 8.8 Universal Screen. DO NOT use the longer screw “g”.
- Dynamic Control with L-Connect 3: Customize your viewing experience with L-Connect 3 software. Access preset themes and modular information, and upload your own videos and photos to create a personalized display that suits your style.
- USB-Powered Secondary Display: Enjoy plug-and-play connection via a 9-pin port or Type-A USB. This innovative design allows the 8.8" screen to function independently as a secondary monitor, displaying hardware stats, media, or custom visuals without using valuable GPU ports.
- Flexible Mounting Options: Versatile mounting bracket that supports height and tilt adjustments. Mount it securely to fan frames, attach it to case panels, or use adhesive pads for flat surfaces, ensuring optimal visibility from any angle.
- Stunning Diffused ARGB Lighting: Enhance your build's aesthetics with a built-in diffused ARGB lighting strip. Fully customizable through L-Connect 3, the lighting offers a spectrum of colors and effects, allowing synchronization with your entire system for a cohesive look.
Why GPU temperature is missing in Task Manager
A GPU entry can appear in Task Manager without a temperature field. The reading depends on the GPU exposing a usable sensor, the graphics driver reporting it, and Windows obtaining it through the supported GPU-performance interface.
Common causes include:
- Integrated graphics: Some integrated GPUs do not expose a temperature that Task Manager can display.
- Incorrect, generic, or outdated driver: Windows may show GPU usage and memory information while omitting sensor data.
- Multiple laptop GPUs: The discrete GPU may be powered down while inactive, so its reading may be blank or stale. Select each GPU entry separately.
- Virtual machines or unusual graphics configurations: The virtual or forwarded GPU may not provide physical sensor data.
- Windows or Task Manager display problems: The temperature may appear on the GPU details page but not beside the GPU entry, or may behave differently between user accounts.
If the reading is absent, install available updates from Settings > Windows Update, install the latest graphics driver from NVIDIA, AMD, Intel, or your computer manufacturer, and restart Windows. Then check the sensor with HWiNFO or the GPU manufacturer’s software. This helps determine whether the problem is limited to Task Manager.
Windows 11 Task Manager does not show CPU temperature
Current Windows 11 Task Manager shows CPU utilization, speed, processes, logical processors, and other performance data, but it does not provide a general CPU-temperature field.
You cannot add CPU temperature by:
- Adding a column on the Processes tab.
- Opening Performance > CPU.
- Changing Task Manager’s update speed.
- Using Resource Monitor.
GPU temperature support does not mean that CPU temperature is also supported. CPU and GPU sensors are exposed through different hardware and driver mechanisms.
Check CPU temperature in UEFI or BIOS
UEFI/BIOS can show a CPU or motherboard temperature before Windows loads. This is useful for confirming that a sensor works, but it does not show the CPU temperature during a game, benchmark, or other Windows workload.
Use the Windows recovery menu as follows:
- Open Settings.
- Go to System > Recovery.
- Under Advanced startup, select Restart now.
- After the restart, select Troubleshoot.
- Select Advanced options.
- Select UEFI Firmware Settings.
- Select Restart.
- In the firmware interface, look for Hardware Monitor, Monitor, PC Health, System Status, or H/W Monitor.
The exact menu name varies by motherboard and computer manufacturer. If UEFI Firmware Settings is not listed, restart the PC and use the manufacturer’s documented firmware key. Common keys include Delete, F2, F10, F11, and F12, but the correct key depends on the device.
Rank #2

- 【GSCOLER X7 PRO ARGB Magnetic GPU Support Bracket】This upgraded smart graphics card holder effectively prevents GPU sagging and bending, protects your heavy flagship graphics card and motherboard from damage. Features strong magnetic base, CNC aluminum alloy body, smart digital display and ARGB sync function, perfect for RTX 4090, RX 7900 XTX and all heavy high-end graphics cards, essential for high-end gaming PC builds.
- 【Smart Digital Display with CPU/GPU Monitoring】Equipped with high-definition digital display screen, specific functions: real-time monitor CPU / GPU temperature, CPU / GPU usage, support free switching between display contents, measurement error less than 1℃. Notice: The display function requires connecting to the motherboard 9-pin USB 2.0 port and installing official dedicated software to work properly. Without installing the software, the display will stay stuck at 888°C abnormal state.
- 【CNC Aluminum Alloy & Stepless Height Adjustment】Made of high-precision CNC machined aluminum alloy, sturdy and durable with ultra-strong load-bearing capacity, no deformation for long-term use. Supports ultra-wide range stepless height adjustment from 60mm to 163mm, perfectly fits all full-tower, mid-tower, mini ITX and SFF cases, adapts to all graphics card installation heights.
- 【5V 3Pin ARGB Sync with Daisy-Chain Header】Equipped with standard 5V 3Pin ARGB interface with extra pass-through daisy-chain header, supports connecting other ARGB devices for synchronized light effect. Fully compatible with ASUS Aura Sync, MSI Mystic Light, Gigabyte RGB Fusion and all major motherboard ARGB software, supports 16 million colors and multiple dynamic light modes, fully customizable to match your PC build theme.
- 【Strong Neodymium Magnetic Base & Tool-Free Installation】Built-in high-strength neodymium magnet base, firmly attaches to any steel chassis without drilling or extra tools, stays stable even when moving the case. Bottom comes with soft non-slip silicone pad, protects your chassis paint from scratches, no damage to your PC case.
Remember that the firmware reading is taken while Windows and your normal applications are not running. It can identify an obviously faulty or missing sensor, but it cannot tell you how hot the CPU becomes during normal use.
Check CPU and GPU temperatures with HWiNFO
HWiNFO is the most complete general-purpose option for Windows 11. It can read sensors from the CPU, GPU, motherboard, storage drives, and other components, and can show current, minimum, maximum, and average values.
Do these 3 things before closing this tab:
1Clear out junk files and repair common Windows errors2Scan for outdated or missing drivers - takes under a minute3Repair Windows errors before they cause bigger problems- Download HWiNFO from its official website.
- Launch the program.
- Select Sensors-only if that option is offered.
- Scroll to the CPU section and GPU section in the sensor list.
- Read the current value, or compare the minimum, maximum, and average columns.
HWiNFO may display several CPU-related readings, including:
- CPU Package
- CPU Die
- Individual core temperatures
- Tctl/Tdie on some AMD processors
- Individual P-core and E-core readings on hybrid Intel processors
For CPU thermal troubleshooting, use the processor’s package, die, or core readings in the CPU section. A motherboard sensor named simply CPU may not be the same as the processor’s internal digital thermal sensor.
HWiNFO can also log values over time and display selected readings in the Windows system tray or as an on-screen display. This is useful when the temperature problem occurs only after several minutes of gaming or sustained work.
Check CPU temperature with Core Temp
Core Temp is a simpler, CPU-focused alternative. It reads the digital thermal sensors inside supported Intel, AMD, and VIA processors and displays individual core temperatures.
Quick wins for a faster PC:
Repair Windows errors before they cause bigger problemsFix Now →Scan for outdated or missing drivers - takes under a minuteDriver Scan →Clear out junk files and repair common Windows errorsFree Scan →Rank #3

- 9.16 inch display; 1920×480 resolution bar screen provides a wide canvas for showing system temperatures, clock speeds, fan speeds and other real-time PC statistics
- Real-time hardware monitoring; bundled software lets you create layouts that display CPU and GPU usage, temperatures, memory and network activity so key information is always visible at a glance
- USB Type-C connection; one cable carries both power and video signal from the PC, simplifying installation and helping keep the inside of the case tidy
- Customizable visuals and animations; supports displaying static images, animated GIFs and video clips so you can combine system monitoring with themed artwork for your build
- Flexible installation options; slim 9.16 inch(L251 x W68 x H17 mm) screen and included mounting accessories allow placement along the side of the motherboard tray, near radiators or behind a glass panel in desktop PC cases
- Download Core Temp from its official website.
- Install and open the application.
- Read the individual core temperatures in the main window.
Core Temp is a good choice when you only need CPU readings. HWiNFO is more suitable if you also need GPU hotspot, motherboard, drive, fan, voltage, or logging information.
Check an AMD GPU temperature
On supported Radeon hardware with the full AMD Software: Adrenalin Edition installation, AMD Software can display GPU temperature metrics and, on compatible systems, CPU temperature.
- Open Start and search for AMD Software.
- Open AMD Software.
- Use its search box to find Metrics.
- Select Performance Metrics.
- Open Additional Metrics if the temperature fields are not already visible.
- Look for GPU Current Temperature and, where supported, GPU Junction Temperature or CPU Temperature.
GPU Current Temperature and GPU Junction Temperature are different readings. Junction temperature is a hotspot-style measurement from the hottest measured area of the GPU package and can be substantially higher. AMD documents hotspot support beginning with Radeon VII and Radeon RX 5000-series and newer products; availability depends on the specific product.
Check an NVIDIA GPU temperature
NVIDIA’s current Windows application is the NVIDIA App, which replaced GeForce Experience for current driver and feature management.
To check available performance information in an overlay:
- Open the NVIDIA App.
- Press Alt + Z to open the NVIDIA Overlay.
- Open the overlay’s performance or statistics controls.
- Enable the available GPU temperature or performance statistics.
The exact statistics depend on the GPU, driver, application, and NVIDIA App version. If the temperature is not available in the overlay, use Task Manager or HWiNFO instead.
Rank #4

- Parameters: This is a new type of mini computer chassis screen. There is no need to install AIDA64, and only a USB cable is required to detect whether the running parameters are normal. Display area: 49X74 (mm), overall size: 55X85 (mm), resolution: 320X480, thickness: 7~ 8 (mm), viewing angle: IPS full viewing angle, interface: USB-TYPEC, shell material: metal
- FAQ: Unable to download URL and unzip, use tutorial, what system is supported? Please don't worry, we will upload video tutorial in the link, which will be reflected in the video. At the same time, we will have product instructions. Finally, our products are compatible and easy to operate
- Features: Support horizontal and vertical screen switching, 0°and 180°two options, energy saving and environmental protection, automatic screen off after shutdown, eye comfort, stepless brightness adjustment
- Function: Displays various data of CPU, memory, hard disk and other hardware, so that users can grasp the computer operation status in time. Through special customized chips, it supports dynamic wallpaper and other forms, can add visual effects, and only takes up a small amount of CPU resources. Compared with the traditional HDMI secondary screen, it only needs a USB data cable to connect, avoiding various problems such as cable clutter
- Packing list: 1 x 3.5-inch screen; 1 x USB data cable; 1 x adjustable bracket; 1 x product manual; 1x Acrylic double-sided tape;1 x packaging box. If you encounter the above problems or other problems about the product, the information we provide cannot solve them for you. Please contact us. We are online 24 hours a day and will serve you as soon as possible.
Why common PowerShell temperature commands fail
Many websites recommend querying the standard Windows temperature-probe class with PowerShell:
Get-CimInstance -Namespace root\cimv2 -ClassName Win32_TemperatureProbe | Select-Object Name, CurrentReading
Free tools Windows power users keep installed
One-click scans. No signup required.
It is not a dependable way to obtain CPU temperature. Microsoft documents that current WMI implementations do not populate Win32_TemperatureProbe.CurrentReading. An empty or unhelpful result is therefore expected on many systems and does not prove that the computer has no temperature sensor.
You may also see this older command:
wmic /namespace:\\root\\wmi PATH MSAcpi_ThermalZoneTemperature get CurrentTemperature
It is not a universal CPU-temperature command for several reasons:
- MSAcpi_ThermalZoneTemperature reports an ACPI thermal-zone value, not necessarily the CPU package or hottest core.
- Some computers do not expose the class.
- The value may represent a broader system region rather than the processor.
- The result is reported in tenths of a degree Kelvin and needs conversion.
- The wmic command-line utility is deprecated.
There is no universally reliable built-in PowerShell command for reading the actual CPU core or package temperature on every Windows 11 PC. Use a sensor utility that communicates with the hardware directly instead.
Outdated Drivers Are Slowing You Down
One free scan finds every outdated or missing driver and matches the right update for your exact hardware.Free scan · exact hardware matchWindows Errors? Fix Them Before They Spread
Repair common Windows errors and clear accumulated junk for a smoother, more stable PC - no reinstall needed.Free scan · no reinstallBest Value
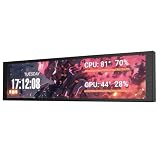
- PC CASE MONITOR AND SENSOR PANEL: The 9.2-inch V92 is a dedicated PC screen for case builds, showing CPU/GPU temperatures, usage, RAM, fan speeds, clocks, weather, and custom widgets. It is not a standard extended monitor.
- 1920 x 462 IPS LCD SCREEN FOR PC: This ultra-wide PC case LCD delivers bright, sharp visuals and wide viewing angles for easy reading through tempered glass. The slim aluminum body measures 242.4 x 63.1 x 12 mm.
- USB-C OR INTERNAL 9-PIN CONNECTION: Connect through an external USB port or an available motherboard USB 2.0 9-pin header. No HDMI or DisplayPort is required, keeping GPU video outputs free. Both USB cables are included.
- FREE STATION SPACE SOFTWARE, NO AIDA64 REQUIRED: Monitor system data and use free themes, plugins, JPG, GIF, MP4, weather, news, and stock widgets. Station Space must remain running. Windows 10/11 only; not compatible with macOS or Linux.
- FLEXIBLE CASE MOUNTING: Install the PC case display horizontally or vertically using the included case fan mounting bracket and rear threaded holes. Check the 9.54 x 2.48 x 0.47 in clearance before purchase for your ATX, micro-ATX, or ITX case.
What CPU or GPU temperature is too high?
There is no single safe temperature threshold that applies to every processor and graphics card. Maximum operating temperatures vary by model, laptop or desktop design, firmware settings, cooling profile, workload, and sensor type.
Do not assume that 70°C is automatically dangerous or that 90°C always means the hardware is failing. A brief rise near a device’s specified limit may cause thermal throttling without immediately damaging the hardware.
More useful warning signs include:
- A temperature that remains near the manufacturer’s specified limit.
- Performance dropping because of thermal throttling.
- An unexpectedly high idle temperature.
- Fans running at maximum speed during a light workload.
- Temperatures steadily increasing during a normal game or application.
Check the manufacturer’s specifications for the exact CPU or GPU. Also identify the sensor being reported: CPU core, CPU package, GPU temperature, GPU junction, memory junction, motherboard, and drive temperatures are not interchangeable.
Best temperature-checking method by situation
| What you need | Recommended method |
|---|---|
| Quick GPU check without installing software | Task Manager > Performance > GPU |
| CPU temperature during normal Windows use | HWiNFO or Core Temp |
| CPU, GPU, hotspots, fans, and logging | HWiNFO Sensors-only |
| AMD GPU current and junction temperatures | AMD Software > Performance Metrics |
| NVIDIA in-game statistics | NVIDIA App > NVIDIA Overlay |
| Sensor check before Windows loads | UEFI/BIOS hardware-monitor page |
| CPU temperature using only built-in Windows commands | No universally reliable built-in method |
FAQ
Can Task Manager show CPU temperature in Windows 11?
No. Windows 11 Task Manager does not provide a general CPU-temperature reading. Use UEFI/BIOS for a pre-boot reading or HWiNFO or Core Temp inside Windows.
Why is GPU temperature missing from Task Manager?
The GPU, driver, virtualized graphics configuration, or Windows installation may not expose compatible sensor data. Integrated graphics and inactive laptop GPUs are common examples. Update the graphics driver and check with HWiNFO or the manufacturer’s software.
Is BIOS temperature the same as gaming temperature?
No. BIOS measures the system before Windows and the game are running. It is useful for checking whether a sensor works, but it does not represent the temperature during a Windows workload.
Are CPU and GPU hotspot temperatures the same?
No. A general GPU temperature and a GPU junction or hotspot temperature come from different measurements. The junction value is usually higher because it represents a hotter area of the GPU package.
Does the WMIC CPU-temperature command work on every PC?
No. ACPI thermal-zone classes depend on the computer’s firmware and may not represent the CPU itself. WMIC is also deprecated, so a hardware-monitoring utility is the more dependable choice.
What’s actually slowing this PC down?
Pick the symptom - the matching free tool is one click away.
The Bottom Line
For a quick graphics-card check, open Task Manager > Performance > GPU. For CPU temperature, use HWiNFO or Core Temp; Task Manager does not provide the reading. Use UEFI/BIOS when you need to confirm a sensor before Windows starts, and use AMD Software or the NVIDIA App when you want vendor-specific GPU metrics.
Quick Recap
Product prices and availability are accurate as of the date/time indicated and are subject to change. Any price and availability information displayed on Amazon at the time of purchase will apply.

