
For a current storm track, advisory, cone, watch or warning, use the National Hurricane Center (NHC). For Atlantic water temperatures and other basin conditions, use NOAA’s Monitoring Hurricane Potential page. The maps answer different questions: the cone forecasts a storm’s center track, while ocean and atmosphere maps provide environmental context—not a forecast that a particular town will be hit.
Which hurricane map should you use?
| Map or product | Purpose and time horizon | What it does not tell you |
|---|---|---|
| NHC live storm tracker | Current individual-storm positions, advisories, forecast tracks, watches and warnings. | A forecast track is not a complete map of every hazard or a guarantee of where impacts will occur. |
| NHC operational cone | The likely route of a storm’s center over the forecast period, with watches and warnings shown for covered U.S. areas. | Storm size, the full hazard footprint, or a precise landfall point. |
| NHC experimental ellipse-based cone | An experimental view of track uncertainty, using ellipses around forecast points. | A location-specific strike probability or a replacement for official warnings. |
| NOAA CPC hurricane-potential monitoring | Atlantic sea-surface temperatures and animations, plus winds, vertical wind shear and precipitable water. | A local landfall forecast or a standalone measure of danger to a coastal community. |
| NOAA CPC seasonal outlook | Probabilistic estimate of overall basin-wide activity during the season. | Which storm will hit land, or how much activity a particular location will experience. |
Where to find the live hurricane season tracker
Open the NHC website for official storm positions, forecast tracks, advisories, watches and warnings. Check it again when conditions change: its storm-status display is live information, not a fixed seasonal summary. On October 3, 2026, the NHC page showed no Atlantic tropical cyclone at the moment it was checked; that observation does not establish what the basin’s status is now.
When a storm is active, use its NHC advisory and map as the authoritative starting point for forecast information. For local instructions and alerts, also monitor your local National Weather Service office and emergency-management officials.
What the hurricane cone means—and what it leaves out
The cone depicts the forecast path of the storm’s center. The traditional cone is based on 67% of historical forecast errors: the NHC expects the center to remain within it about two-thirds of the time, based on that forecast-error measure. It does not show the storm’s size. Strong winds, storm surge, flooding rain, tornadoes and dangerous surf can extend well beyond the cone, and serious impacts may occur far inland.
Recommended Free Tools
#1 Best Overall
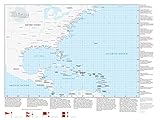
- 33 x 44 inches. Laminated. Flat map, tubed for shipping.
- Perfect for home, business, school, or governmental emergency planning agency, this map of the central and western North Atlantic Ocean, Caribbean Sea, and Gulf of Mexico is divided into one degree latitude and longitude grid lines to make the tracking of tropical systems easy. The map includes a glossary of tropical meteorology terms and an explanation of the Saffir-Simpson Hurricane Wind Scale.
- Created by Globe Turner, one of the leading producers of map products in the USA.
For 2026, the operational NHC display uses one shading across the five-day cone and includes coastal and inland tropical-storm and hurricane watches and warnings for covered areas of the continental United States, Hawaii, Puerto Rico and the U.S. Virgin Islands. A watch means an impact is possible; a warning means it is expected or happening. Follow local officials’ instructions rather than treating the cone boundary as a safety line.
The experimental ellipse-based cone
The NHC is also testing an experimental cone that uses ellipses anchored on forecast points to represent uncertainty in both storm speed and direction. NOAA says this version represents 90% of track possibilities, compared with 67% for the traditional cone’s historical forecast-error basis. That figure concerns the forecast track, not the chance that a particular place will be struck. NOAA cautions that technical issues can affect the experimental product’s timeliness or availability, so treat it as an additional view, not a replacement for the operational forecast.
Rank #2

- OceanGrafix provides mariners with the most up-to-date, NOAA-approved nautical charts ever offered
- Printed on demand
- All Notice to Mariners corrections are applied to the chart when printed
- Meets U. S. and international carriage requirements for commercial vessels defined in SOLAS Chapter V Regulation 19.2.1.5
- U. S. Coast Guard approved
Where to see Atlantic water temperatures
NOAA’s Monitoring Hurricane Potential page links to Atlantic sea-surface-temperature (SST) maps, animations and recent-week views. It also provides environmental products for winds, vertical wind shear and precipitable water. Use the graphics to understand conditions across the basin; SST alone does not determine whether a storm will form, where it will travel or what impacts a town will face.
The CPC page footer says it was last modified May 27, 2015. That is the page’s modification date, not the date of every linked observation or graphic. Check the dates and labels attached to individual products when interpreting changing conditions.
Free tools Windows power users keep installed
One-click scans. No signup required.
Rank #3
- AMAZING HIGH QUALITY IMAGES- All Images Are Printed On Photo Paper To Ensure The Highest Quality Images Available For Your Home Or Office. You'll Love The Crispness, Detail And Clarity Of Each And Every Image We Offer.
- 2. FULLY LAMINATED-Our Photos And Posters Are Fully Laminated To Protect Them From Dust, Liquids And Other Forms Of Environmental Damage. Each Image Remains As Fresh And Beautiful As The Day You Placed It On Your Wall.
- 3. LARGE POSTERS-Our Laminated Posters Are Carefully Curated, So They Will Add To The Character Of Any Room They Are Placed In, And Add Vivid Colors And Imagery To Any Home Or Office Space.
- 4. CAREFULLY PACKAGED - Our Posters are Securely Packaged To Ensure That Your New Posters Arrive At Your Home Or Office In Perfect Condition And Ready To Hang.
- 5. 20 By 30 INCH IMAGE SIZE-The 20 Inch By 30 Inch Size Of Our Images Guarantee That They Will Have A Significant Visual Impact In Any Room You Place It In. Our Standard 20 By 30 INCH Size Also Makes It Easy For You To Choose From A Wide Variety Of Frames And Styles To Complete The Presentation.
What the 2026 Atlantic hurricane outlook says
NOAA’s Climate Prediction Center updated its 2026 Atlantic outlook on August 6, 2026. It assigned a 75% chance to below-normal activity, a 20% chance to near-normal activity and a 5% chance to above-normal activity. The forecast ranges, each with a 70% probability, were 7–13 named storms, 2–6 hurricanes and 0–2 major hurricanes. The ranges included the two named storms recorded by the time of that update.
For context, the CPC’s 1991–2020 average is 14 named storms, 7 hurricanes and 3 major hurricanes. These are basin-wide seasonal activity measures, not expected landfalls. CPC explicitly says its outlook is neither a seasonal landfall forecast nor a forecast for any particular location. A season outlook cannot tell you whether your community is at risk from a storm developing later; consult the NHC forecast and local alerts for immediate decisions.
How to use maps when a storm could affect you
- Check the official forecast: Go to NHC for the latest storm advisory, track and watches or warnings.
- Read the cone as a center-track forecast: Do not use its edge to decide that an area outside it is safe.
- Check local hazard information: Follow your local NWS office and emergency-management agency for rainfall, wind, storm-surge and evacuation guidance. Know your local evacuation zone.
- Prepare before conditions worsen: Keep more than one way to receive forecasts and alerts, make a household plan and have an emergency kit ready. A kit supports preparedness; it does not replace warnings, evacuation orders or a plan tailored to your household.
Why the cone is not a landfall prediction
A cone represents uncertainty in the forecast path of a storm’s center, not the storm’s complete reach and not the probability that a particular location will be hit. The storm’s hazards are distinct: surge, destructive wind, heavy-rain flooding, tornadoes and high surf or rip currents each have their own possible extent. A community outside the cone can still experience dangerous conditions, including well inland. Use local hazard forecasts and official instructions alongside the track map.
Quick Recap
Product prices and availability are accurate as of the date/time indicated and are subject to change. Any price and availability information displayed on Amazon at the time of purchase will apply.

