
Do these 3 things before closing this tab:
1Fix the driver behind crashes, sound loss and screen glitches2Clear out junk files and repair common Windows errors3Scan for outdated or missing drivers - takes under a minuteA managed MQTT broker dashboard should help you monitor traffic, inspect and manage clients, control access, configure integrations, and diagnose problems—not merely show whether a deployment is online. The available controls vary by provider, service, plan, region, and deployment mode, so compare the dashboard against the operational work your team needs to do.
What a managed MQTT broker dashboard does
A broker console is an operational surface for observing and administering a deployment. EMQX describes its Dashboard as a browser-based console for monitoring and managing clusters and configuring broker features. Its documented capabilities include cluster and node information, metrics, client and subscription views, access-control configuration, integrations, configuration changes, diagnostics, and account and security administration. EMQX Dashboard documentation
A visual console is not necessarily required to use a broker. EMQX documentation states: “EMQX can still be used normally without the Dashboard enabled. The Dashboard just provides the option for users to use it visually.”
Which dashboard capabilities matter operationally?
Monitoring broker and message activity
Look for enough visibility to tell whether the deployment and its nodes are healthy, whether clients are connected, and how message traffic is behaving. Depending on the service, useful views may include message metrics, subscriptions, and retained messages. EMQX Cloud documents these alongside client and session monitoring on its Monitor page. EMQX Cloud monitoring documentation
#1 Best Overall
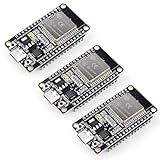
- Dual-Core Performance Up to 240 MHz: Run sensor processing, wireless communication, automation logic and connected-device tasks on a 32-bit dual-core ESP32 platform designed for responsive embedded and IoT projects
- Built-in Wi-Fi and Bluetooth 4.2: Connect to 2.4 GHz Wi-Fi networks or use Bluetooth Classic and BLE for wireless sensors, smart devices, remote controls, home automation and other connected projects
- Flexible Power-Saving Modes: ESP32 power-management features support dynamic clock scaling and low-power operating modes, helping developers reduce energy use in compatible sensing, monitoring and connected-device applications, suitable for battery-powered Internet of Things (IoT) devices.
- USB-C Programming with CP2102: Connect through USB-C for power, sketch uploads and serial monitoring, while GPIO, UART, SPI and I2C interfaces support sensors, displays, motor drivers and other modules (USB-C cable not included)
- Over-the-Air Update Support: Configure OTA functionality through a compatible ESP-32 software framework to update deployed firmware over Wi-Fi without reconnecting the board by USB for every revision
Check how metrics can be consumed outside the console as well. EMQX Cloud documents Prometheus and Datadog integrations; if your team relies on a different monitoring stack, confirm that the intended service supports a workable export or integration path.
Inspecting and managing clients
Monitoring is more useful when it leads to safe, specific actions. Check whether operators can inspect connection details, disconnect a client, view its sessions, and see its subscriptions. AWS IoT Core documents console and API support for these connection-management tasks. AWS IoT Core client management documentation
Rank #2

- This kit comes with NodeMCU micro controller board which is based on ESP8266, an enconimcal and powerful chip which supports wifi and IDE .
- This kit is developed specially for those want to learn and play IoT ( Internet of things). In order to connect Things to Internet, for this kit, we uses a very popular and simple IOT protocol - MQTT which has many free open-source coding resources and mobile APP to help beginners to get started in an easy and economical way. Once you master MQTT, you can also buit a smarter home or something else .
- The kit includes free on-line 17 sample lessons with detailed circuit graph, step-by-step tutorial, fully-tested sample codes and video which can save lots of your time and speed up your learning progress .
- The kit is nicely packed in plastic box. This IOT programming learning starter kit includes more than 22 kinds of different electronic components items .
- The kit can not only help students make many fancy projects in science fair, hackathon and homeworks, but also prepare the necessary knowledge base for their future career path in an interesting way.
Confirm the scope of each action before relying on it in incident procedures: for example, whether an operator can disconnect one client or must make a broader change, and whether the console exposes enough session and subscription context to identify the right client.
Managing access and administrative security
Review how the service handles authentication and authorization configuration, operator roles, account administration, and audit visibility. EMQX documents visual access-control configuration as well as account features that include audit logs, API keys, and single sign-on. Those documented EMQX capabilities are examples, not a guarantee that another provider—or every EMQX deployment mode—offers the same controls.
Rank #3

- Working voltage: Wide voltage DC 12-28V
- Working Current : Standby current 15MA, 1 relay open 50MA, 2 relays open 85MA, 3 relays open 120MA, 4 relays open 155MA
Configuring integrations without coupling applications to internals
A console may include rules, connectors, event routing, and transformations that move broker data into business systems. Treat this as a security boundary, not just a convenience: who can configure a route, what client-originated data it forwards, and what permissions the destination topic grants all matter.
EMQX Cloud recommends filtering and transforming client events before republishing them to business topics, then applying independent access controls to those topics. It also advises against making business systems depend directly on internal $SYS topic structures. EMQX Cloud Data Integration documentation
Rank #4

- Working voltage: Wide voltage DC 12-28V
- Working Current : Standby current 15MA, 1 relay open 50MA, 2 relays open 85MA, 3 relays open 120MA, 4 relays open 155MA
Troubleshooting connections and subscriptions
When messages are delayed or clients cannot connect, diagnostic tools can help narrow the cause without relying only on application-side guesses. EMQX documents online MQTT-over-WebSocket debugging, topic metrics, slow-subscription diagnostics, and log tracing. EMQX diagnostics documentation
Before selecting a service, check whether these tools are available in its managed offering and whether they expose the detail your operators need. A feature documented for a product does not by itself establish availability in every plan, region, or deployment mode.
The Tool Desk
Outbyte PC Repair FREERepair Windows errors before they cause bigger problemsFix Now →Outbyte Driver Updater FREEScan for outdated or missing drivers - takes under a minuteDriver Scan →Best Value

- COMPATIBLE WITH ARDUINO UNO R4 WIFI: Works seamlessly with Arduino IDE for coding uploading and debugging as a drop in alternative for Uno R4 WiFi projects
- 32 BIT RA4M1 WITH ESP32 S3: Combines RA4M1 ARM Cortex M4 processor with ESP32-S3 coprocessor for powerful performance and built in WiFi and Bluetooth connectivity
- DESIGNED FOR STEM AND IOT PROJECTS: Ideal for students makers engineers and educators to learn electronics embedded systems wireless communication and IoT development
- EASY CONNECTION WITH 3 PIN HEADERS: All GPIOs arranged in 2.54mm VCC GND Signal groups for quick and reliable connection to sensors modules and devices
- READY TO USE WITH USB C: Includes USB Type C connection for stable power and programming with tutorials available for fast learning and project setup
How to compare dashboards
Use the same operational questions for each candidate, then verify answers against the specific managed service you expect to run. The examples below describe capabilities documented by the named providers; they are not a claim that the products have feature parity.
Quick Recap
| Comparison area | What to verify | Documented example |
|---|---|---|
| Monitoring | Cluster and node status, message rates, client counts, subscriptions, and retained-message access. | EMQX Cloud documents deployment metrics, clients and sessions, subscriptions, retained messages, and monitoring integrations. Source |
| Client actions | Whether operators can inspect connection details, disconnect clients, and view sessions and subscriptions. | AWS IoT Core documents console and API support for connection management, sessions, and subscription views. Source |
| Security operations | Authentication and authorization controls, roles, audit visibility, and account administration. | EMQX Dashboard documentation describes visual access control, audit logs, API keys, and single sign-on. Source |
| Integration | Rules, transformations, connectors, alert routes, and external metric export. | EMQX Cloud documents Data Integration and monitoring integrations including Prometheus and Datadog. Monitoring source; Data Integration source |
| Troubleshooting | Browser-based client testing, topic-level metrics, slow-subscription visibility, and logs or traces. | EMQX documents MQTT-over-WebSocket debugging, topic metrics, slow-subscription diagnostics, and log tracing. Source |
What to verify before choosing a service
- Confirm each required feature for the exact managed product, plan, region, and deployment mode—not just the vendor’s general product documentation.
- Check whether operators can carry out the client, session, and subscription actions needed for your incident process.
- Verify how dashboard access is controlled and whether audit information is available to the people responsible for security and operations.
- Trace how integrations handle client-originated events, and ensure business topics have their own suitable authorization rules.
- Confirm that exported metrics and diagnostic detail fit your monitoring and troubleshooting workflows.
Product prices and availability are accurate as of the date/time indicated and are subject to change. Any price and availability information displayed on Amazon at the time of purchase will apply.

