
What’s actually slowing this PC down?
Pick the symptom - the matching free tool is one click away.
A basic website monitor in Node.js can make one bounded HTTP request on a schedule, check the response status, record how long the request took, and report failures. The key detail is that a completed fetch() is not proof a site is healthy: HTTP errors such as 404 still produce a response, so your script must inspect its status.
What this script can—and cannot—tell you
This tutorial builds a small periodic availability check for a URL you configure. Each run sends one request, treats selected HTTP statuses as healthy, records elapsed time, and reports network errors, unsuccessful statuses, or timeouts. It is useful for a developer who wants a simple check from a local machine or a scheduled process.

It is not a full synthetic-monitoring service. It does not, by itself, provide persistent history, alert delivery, distributed probes, or a universal retry policy. Those choices depend on what you are monitoring and how you need to respond to failures. A successful HTTP response also does not prove that every user can reach the site, or that the page’s important content is correct.
Choose what counts as healthy
Decide the success rule before writing the loop. For a simple endpoint, you might accept only status 200; another endpoint may legitimately return a different status. A fulfilled fetch promise only means a response’s status and headers arrived, not that the status is successful. A 404, for example, still fulfills the promise. Inspect response.status or response.ok explicitly.
Free tools Windows power users keep installed
One-click scans. No signup required.
#1 Best Overall

- 3.5 Inch Hot Plug Hard Drive PowerEdge T340 Tower Server Chassis
- Microsoft Windows Server 2019 Standard Operating System
- Processors: Intel Xeon E-2124 Quad-Core 3.3GHz 8MB CPU, Up To 4.3GHz Turbo
- Memory: 32GB (2 x 16GB) DDR4 PC4-21300 2666MHz Unbuffered Memory
- Hard Drive: 8TB (4 x 2TB) 7.2K RPM 6Gb/s SATA 3.5 Inch HDDs in RAID
If the site can return a successful status while showing an error page, check for a stable content marker as well. Avoid relying on text that changes frequently, such as a timestamp or rotating headline. A content check is specific to the page and is not included in the basic script below.
Build the monitor with Node.js fetch
Prerequisites and configuration
Use a Node.js runtime that provides the built-in fetch and AbortSignal.timeout() APIs. The Node.js v24.2.0 globals documentation describes AbortSignal.timeout(delay) as returning a signal that aborts after the specified number of milliseconds, and lists the API as added in Node.js v17.3.0 and v16.14.0. Check the runtime you actually deploy; do not assume every environment uses the same version.
Save the following as monitor.mjs. It reads the URL, interval, and request timeout from environment variables so you do not have to edit source code to change the target. Set an appropriate value for your endpoint rather than blindly using the example defaults.
const target = process.env.MONITOR_URL;
const intervalMs = Number(process.env.INTERVAL_MS ?? 60_000);
const timeoutMs = Number(process.env.TIMEOUT_MS ?? 10_000);

if (!target) {
  throw new Error('Set MONITOR_URL to the URL to monitor.');
}

let parsedUrl;
try {
  parsedUrl = new URL(target);
} catch {
  throw new Error('MONITOR_URL must be a valid absolute URL.');
}

if (!['http:', 'https:'].includes(parsedUrl.protocol)) {
  throw new Error('MONITOR_URL must use http: or https:.');
}

if (!Number.isFinite(intervalMs) || intervalMs <= 0) {
  throw new Error('INTERVAL_MS must be a positive number of milliseconds.');
}

if (!Number.isFinite(timeoutMs) || timeoutMs <= 0) {
  throw new Error('TIMEOUT_MS must be a positive number of milliseconds.');
}

async function checkOnce() {
  const startedAt = Date.now();
  const started = new Date(startedAt).toISOString();

  try {
    const response = await fetch(target, {
      method: 'GET',
      signal: AbortSignal.timeout(timeoutMs),
    });
    const elapsedMs = Date.now() - startedAt;

    // This example accepts any 2xx response. Change the rule if your
    // endpoint has a different documented healthy status.
    const healthy = response.status >= 200 && response.status < 300;

    const result = {
      checkedAt: started,
      url: target,
      healthy,
      status: response.status,
      elapsedMs,
    };
    console.log(JSON.stringify(result));

    // Release the response body without downloading it for this check.
    if (response.body) {
      await response.body.cancel();
    }
  } catch (error) {
    console.log(JSON.stringify({
      checkedAt: started,
      url: target,
      healthy: false,
      elapsedMs: Date.now() - startedAt,
      error: error instanceof Error ? error.name : 'UnknownError',
      message: error instanceof Error ? error.message : String(error),
    }));
  }
}

async function run() {
  for (;;) {
    await checkOnce();
    await new Promise((resolve) => setTimeout(resolve, intervalMs));
  }
}

run().catch((error) => {
  console.error(error);
  process.exitCode = 1;
});
Run it
Set the target and optional timing values in the environment, then start the script:
Recommended Free Tools
Rank #2

- Dell PowerEdge R730xd 24B SFF 2U Server
- 2x Intel Xeon E5-2690 v4 2.6Ghz 14-Core (28-cores Total)
- 128GB DDR4 RAM – 4x 1.2TB 10K SAS 2.5” 12Gb/s
- Dell H730P mini 2GB 12Gb/s RAID
- 2x 750W PSU - 2x 10Gb SFP+ 2x 1Gb (RJ45) NIC
MONITOR_URL=https://example.com TIMEOUT_MS=10000 INTERVAL_MS=60000 node monitor.mjsOn shells where inline environment assignments are not supported, set the variables using that shell’s syntax before running node monitor.mjs. Each completed check emits one JSON line. A healthy response includes healthy: true, the HTTP status, and elapsed milliseconds. A non-2xx response is reported with healthy: false and its status; a timeout or other request error is reported with healthy: false and an error name and message.
Understand the loop and result fields
MONITOR_URLmakes the destination an explicit deployment setting. The script rejects a missing, malformed, or non-HTTP(S) URL before entering the loop.TIMEOUT_MScaps how long the request is allowed to take. When the timeout signal aborts the operation, the catch branch records it as a failed check rather than mistaking the absence of a response status for success.INTERVAL_MSis the delay after one check completes. Thus the start-to-start cadence is approximately the request duration plus the configured delay, not a fixed wall-clock schedule.elapsedMsmakes a slow response visible even when its status is healthy. This example uses wall-clock milliseconds for a simple log; use a monotonic clock if you need precise duration measurement in a more demanding measurement system.response.body.cancel()tells fetch that the body is not needed. The script checks headers and status, not full-page content. For a content marker check, read the response body instead and include the marker test in your health rule.
Set a timeout that really cancels the request
For built-in fetch, passing an abort signal makes the request cancelable. This script passes the signal from AbortSignal.timeout(timeoutMs); when that signal aborts, the operation rejects and the error is handled as a failed check.
If you use the lower-level node:http client, do not assume that setting its timeout option or calling setTimeout() cancels the request. Node.js v26.10.0 HTTP documentation says those settings add timeout behavior or an event; they do not abort the request by themselves. Handle the timeout explicitly or pass an AbortSignal supported by the outgoing request. The lower-level API gives you more control over request and response handling, but requires more code than fetch.
Choose a cadence and decide what happens on failure
The example waits for each check to finish and then waits INTERVAL_MS. That avoids starting a new request while the previous check is still in progress. If a request takes close to its timeout, the effective interval between checks will be longer than the configured delay. Decide on a cadence appropriate for your endpoint and the load you are willing to generate; there is no one schedule established for every site.
Rank #3

- MODEL P74439-005: Compact and affordable HPE ProLiant MicroServer Gen11 powered by Intel Pentium Gold G7400 3.7GHz processor, ideal for file sharing, NAS, and basic business workloads
- READY OUT OF THE BOX: Includes 16GB DDR5 UDIMM memory (expandable to 128GB), one 1TB SATA 6G Business Critical HDD, embedded Intel VROC SATA, dedicated iLO-M.2 port kit, 180w external power adapter and 1/1/1 warranty for dependable plug-and-play server operation
- WHISPER-QUIET & SPACE-SAVING: Ultra-compact mini tower design fits easily in small office spaces; supports wall, flat, or vertical placement for deployment flexibility
- INTEGRATED REMOTE MANAGEMENT: Comes with HPE iLO 6 and embedded TPM 2.0 for secure, license-free remote server administration through shared port access
- EXPANDABLE DESIGN: Two PCIe slots (including PCIe 5.0) and four LFF-NHP drive bays provide robust options for storage and component scalability. Features new MR408i-p controller support for enhanced storage performance
The script logs every result to standard output. That is enough to see what happened in a terminal, but a process that restarts loses its local history unless another system stores those logs. To make the check useful operationally, choose how results will be retained and who or what will act on failures. A local periodic check does not automatically notify anyone.
- For a simple local check, keep the process running in a terminal and inspect the JSON lines.
- For scheduled execution, use the scheduler or process manager appropriate to your environment, and decide how it should handle a script exit or restart.
- For alerting or historical analysis, send results to a log collector or monitoring system that you already operate. This example does not prescribe a vendor or destination.
- Decide whether to add retries. A retry may distinguish a transient failure from a continuing one, but it also changes request volume and when a failure is reported. Pick a policy based on the consequence of a missed or delayed alert.
When to use a screenshot check instead
An HTTP availability check and a browser screenshot answer different questions. This script checks a server response; it does not render the page or confirm how the page looks to a visitor. If your goal is to capture a rendered page for review, ScreenshotNeo is a separate screenshot API and MCP server made by Yorker Media. Its capture can complement a status check, but a screenshot should not be treated as a replacement for this script’s explicit HTTP-status test. See ScreenshotNeo.
Or skip the browser setup
If you need a rendered screenshot rather than an HTTP availability result, ScreenshotNeo accepts a URL in one GET request and returns an image or PDF. The API supports PNG, JPEG, and WebP screenshots. Use your API key in place of YOUR_API_KEY; see the ScreenshotNeo API documentation for request options.
curl -G "https://api.screenshotneo.com/v1/shot" -d access_key=YOUR_API_KEY --data-urlencode url=https://example.com -o shot.webpScreenshotNeo accepts cookie or consent banners and removes more than 60 known consent platforms, newsletter popups, and chat widgets before capture; each of those steps can be turned off. Bot checks or CAPTCHAs, blank pages, timeouts, failed loads, and cache hits are not billed, and the response identifies page verdict and billing status in headers. Its MCP server provides take_screenshot, get_page_info, and capture_pdf tools for AI agents and MCP clients. The Free plan includes 1,000 shots per month with no card; paid plans start at $5 for 3,000 shots. Start at ScreenshotNeo free sign-up.
Troubleshoot common failures
The script exits before checking
If it reports that MONITOR_URL is missing or invalid, set it to a complete absolute URL such as https://example.com. Confirm that the URL uses http: or https: and that the environment variables contain positive numeric millisecond values.
Rank #4
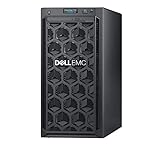
- Dell PowerEdge T140 Mini Tower Server for Small Businesses, Branch Locations, and Home Offices
- Intel Xeon E-2124 Quad-Core 3.3GHz 8MB CPU, Max Turbo Up To 4.3GHz Memory: 32GB DDR4 PC4-21300 2666MHz Unbuffered Memory
- 8TB (4 x 2TB) 7.2K 6Gb/s SATA 3.5" HDDs for High Capacity Storage; PERC S140 6Gb/s RAID Controller
- iDRAC9 Basic; On-Board Dual Port 1Gb LOM
- iDRAC9 Basic; On-Board Dual Port 1Gb LOM
The check reports a non-2xx status
The request reached a server that returned an HTTP response, but this example’s success rule classifies that status as unhealthy. Inspect the status and confirm what the endpoint is supposed to return. If the service legitimately uses a different status, change the explicit health rule rather than treating every fulfilled fetch as success.
The check reports an abort or timeout
The request exceeded TIMEOUT_MS and was canceled by the timeout signal, or another abort occurred. Check that the site is responsive from the machine running the script, then choose a timeout that reflects the endpoint’s expected response time. Raising the limit can reduce false failures for a slow endpoint, but means the script waits longer before recording a failure.
The check reports a network, DNS, or TLS error
No usable HTTP response was received, so there is no status to evaluate. Verify the hostname, network access, DNS resolution, and TLS configuration from the machine running Node.js. The catch branch records an error name and message; avoid logging secrets if you later add credentials or sensitive request details.
It works in a terminal but not in deployment
Compare the Node.js runtime and environment variables in both places. The chosen runtime must expose the APIs the script uses, including fetch and AbortSignal.timeout(). Also check whether the deployed process is allowed to make outbound requests to the target, and whether the process manager restarts or terminates long-running scripts.
Healthy responses are slow or the log is too large
Use elapsedMs to distinguish slow healthy results from failures. The current loop logs every check indefinitely; if that is too noisy for the destination you choose, set an appropriate retention policy there or change the reporting policy deliberately. Do not discard elapsed-time data if response speed is part of the reason you are monitoring the endpoint.
Implementation choices at a glance
| Choice | What it offers | Timeout behavior | When it fits |
|---|---|---|---|
Built-in fetch |
Concise request code and a Response with a status to inspect. | Pass an AbortSignal, such as AbortSignal.timeout(), to cancel the request. |
A small availability checker with straightforward status handling. |
node:http |
Lower-level access to request and response lifecycle details. | timeout and setTimeout() alone do not abort; explicitly handle timeout behavior or use AbortSignal support. |
A checker that needs more detailed control and is prepared for additional implementation complexity. |
FAQ
Does this monitor prove the whole website is working?
No. It verifies one HTTP request from the machine running the script. It does not establish that every route, user location, browser-rendered interaction, or backend dependency is healthy.
Should I monitor a homepage or a health endpoint?
Use the URL whose failure would matter to the outcome you care about. A dedicated endpoint can give a more direct service signal; a homepage can reveal a user-facing route issue. The right choice depends on what your application exposes and what you want the check to detect.
Crashes, No Sound, or Screen Glitches?
Random freezes, missing sound and display glitches usually trace back to one bad driver. Find and replace yours safely.Free scan · under a minutePC Slower Than It Used to Be?
A free scan shows the junk files, broken settings and background clutter dragging Windows down - then fixes them in one click.Free scan · Windows 10 & 11Quick Recap
Product prices and availability are accurate as of the date/time indicated and are subject to change. Any price and availability information displayed on Amazon at the time of purchase will apply.

