
Free tools Windows power users keep installed
One-click scans. No signup required.
iTechGuides is reader-supported. When you buy through links on our site, we may earn an affiliate commission. As an Amazon Associate I earn from qualifying purchases. Learn more
Convexity is the part of risk that a straight-line estimate misses: as prices move, an exposure’s sensitivity can change, sometimes sharply near a threshold. That can make a strategy look steady in ordinary conditions while leaving it vulnerable to outsized losses in a severe move. Option prices can offer clues about how markets price downside risk, but no single measure captures the whole danger.
What does convexity mean in a risk discussion?
Convexity describes how an outcome bends rather than changing at a constant rate. If an asset’s price moves a little, a linear sensitivity estimate—often represented by delta—can be a useful local approximation. But that estimate can become less reliable as the move grows, because the exposure itself may change.
| # | Preview | Product | Price | |
|---|---|---|---|---|
| 1 |

|
Fundamentals of Risk Management: Understanding, Evaluating and Implementing Effective Enterprise... | $41.66 | Buy on Amazon |
| 2 |
|
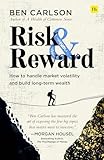
Risk and Reward | $15.54 | Buy on Amazon |
| 3 |

|
I Got Stuck with Risk Management - the Non-Expert's Guide | $19.95 | Buy on Amazon |
| 4 |

|
Against the Gods: The Remarkable Story of Risk | $14.71 | Buy on Amazon |
| 5 |

|
Risk: A User's Guide | $23.96 | Buy on Amazon |
A plain-vanilla option illustrates the point. Its payoff depends on the underlying price relative to a strike price, so the payoff is not a straight-line function of that price. The Basel Committee on Banking Supervision’s sensitivities-based market-risk framework treats options as having both vega risk (sensitivity to implied volatility) and curvature risk. In practical terms, a position’s risk depends not only on the direction of a move but also on how far the underlying moves and how volatility changes along the way.
The Tool Desk
Outbyte PC Repair FREEClear out junk files and repair common Windows errorsFree Scan →Outbyte Driver Updater FREEFix the driver behind crashes, sound loss and screen glitchesFind Drivers →Convexity is not automatically good or bad. An option buyer generally pays a premium for a payoff that can grow disproportionately in favorable conditions; the seller receives that premium but takes the opposite, potentially sharply worsening exposure. The sign and consequences depend on which side of the trade an investor or institution holds.
#1 Best Overall
Why can steady returns conceal tail risk?
Some strategies collect relatively small gains across many ordinary periods while remaining exposed to a large loss if a severe condition occurs. That pattern is sometimes described as option-like: the frequent gains resemble collecting a premium, while the infrequent stress loss resembles the obligation attached to selling protection. It does not mean every strategy with smooth income has the same payoff or risk.
In a 1 March 2007 speech for the Bank for International Settlements (BIS), William White described the concern this way: “This evolution towards instruments with option-like payment structures could potentially raise ‘tail risks’, while at the same time giving the impression that the financial system is stable and that risks are low.” The warning is about the mismatch between how calm periods look and how losses may behave under stress—not a claim that every quiet market is hiding a crisis.
A useful question is therefore not just “How much has this position earned recently?” but “What must happen for the payoff to change regime, and who bears the loss if it does?” A strategy’s average return or routine-period volatility can fail to reveal losses concentrated in uncommon, severe scenarios.
Rank #2
How do thresholds create asymmetric behavior?
A threshold is a level or condition at which incentives, contractual rights, or behavior change. The resulting payoff need not jump discontinuously: it may instead bend, develop a kink, or become much more sensitive as the threshold approaches. That change can make outcomes asymmetric—the response to an adverse move differs from the response to an equally sized favorable move.
Fixed-rate loans and borrower options
Basel Committee guidance on interest rate risk in the banking book gives a concrete example. When market rates fall, a borrower may repay a fixed-rate loan and refinance at a lower rate. When rates rise, the borrower may be more likely to keep the existing loan. The lender’s expected cash flows therefore respond differently to falling and rising rates. This borrower behavior is option-like and can affect the bank’s value, earnings measures, and hedging needs.
For the lender, a model that assumes the loan simply remains outstanding to its scheduled maturity can miss that behavioral response. Estimating the exposure requires considering the borrower’s incentive to prepay or retain the loan, rather than treating contractual cash flows as certain under every rate path.
Why a threshold matters beyond the exact trigger
Risk may change before a trigger is crossed. As a position approaches an exercise, refinancing, collateral, or other decision threshold, the probability of a behavior change can rise. A stress analysis should therefore consider both the trigger itself and the path toward it; a small move near a threshold may matter more than the same move far away.
Recommended Free Tools
What can option prices say about downside tail risk?
Option-implied volatility is inferred from option prices. Comparing the implied volatility of out-of-the-money puts and calls at matching maturity and moneyness produces a measure commonly called a risk reversal. A larger difference can indicate that investors are pricing downside protection differently from upside exposure—in other words, that perceived risk is skewed rather than symmetric.
This answers a different question from a broad expected-volatility measure. The BIS’s 2013 discussion contrasts risk-reversal measures with the VIX: VIX is a symmetric measure of expected volatility and does not specifically isolate downside risk. A risk reversal can help reveal the relative price of downside versus upside options, but it is not a direct probability forecast of a crash and does not establish that a particular loss will occur.
Rank #4
The BIS paper reported that its tail-risk measures declined by an average of 10% around 18 unconventional US Federal Reserve policy announcements studied. That is a historical result for that sample and those option-implied measures, not evidence that policy announcements reliably reduce tail risk or that such a decline predicts what happens next.
Independent reader supportYour contribution helps us test, update, and keep practical guides available for everyone.How should convexity and tail risk be stress-tested?
A stress test is a conditional question—what would happen if a specified scenario occurred—not a forecast that the scenario will occur. For nonlinear exposures, a useful test needs to look beyond small, isolated price changes and examine how the position behaves as underlying prices, volatility, rates, and relevant borrower or counterparty behavior change together.
Quick wins for a faster PC:
Clear out junk files and repair common Windows errorsFree Scan →Scan for outdated or missing drivers - takes under a minuteDriver Scan →Repair Windows errors before they cause bigger problemsFix Now →- Test more than local sensitivity. Delta-like estimates describe nearby moves. Add larger scenarios that can expose curvature and changing sensitivities.
- Include the threshold and the approach to it. Examine outcomes just before and after relevant exercise, prepayment, collateral, or behavioral levels.
- Vary volatility and asymmetry. An underlying price shock may coincide with changing implied volatility and a shift in the relative pricing of puts and calls.
- Account for behavior. Consider how borrowers, counterparties, or other participants may respond when incentives change, rather than holding their behavior fixed by assumption.
- Consider liquidity and feedback. A position’s theoretical payoff may not capture the difficulty of trading or hedging it in stressed conditions, or how one participant’s actions can affect others.
The BIS speech by White specifically emphasizes stress testing that captures nonlinearities and tail events. No finite set of scenarios can describe every possible stress, but scenarios can expose where an apparently smooth return profile depends on a narrow range of market conditions.
Best Value
What is known about “the expensive sixth point”?
The exact-title search excerpt identifies “The Expensive Sixth Point: Convexity, Thresholds, and the Price of Tail Risk” as Part 17 of TechWithJoshi’s “Fat Tail Notes” and says the preceding discussion concerned disagreement over the Greenspan put. The page view did not provide readable article text. That supports identifying the installment and its stated context, but it does not establish what its “sixth point” means, which thresholds it discusses, or what example or conclusion the author intended.
Accordingly, the concepts above explain the title’s terms using BIS and Basel Committee material; they should not be read as a reconstruction of the installment’s argument or as a claim about the Greenspan-put debate.
Quick Recap
Product prices and availability are accurate as of the date/time indicated and are subject to change. Any price and availability information displayed on Amazon at the time of purchase will apply.

