
The Tool Desk
Outbyte PC Repair FREERepair Windows errors before they cause bigger problemsFix Now →Outbyte Driver Updater FREEFix the driver behind crashes, sound loss and screen glitchesFind Drivers →iTechGuides is reader-supported. When you buy through links on our site, we may earn an affiliate commission. As an Amazon Associate I earn from qualifying purchases. Learn more
If you want to stay informed without remembering to open another app, automated reports can deliver a regular briefing. If you need to explore a change, compare periods, or find out what is driving a result, a dashboard is usually more useful. For many owners, the practical answer is to use both: a short scheduled update for awareness and a dashboard for investigation.
Dashboard vs. automated report: what is the difference?
A dashboard is an interactive place to view and explore data. Depending on the service and your permissions, you may be able to filter results, compare time periods, or open details behind a metric.


An automated report is information sent to people on a schedule, often by email or as an attached file. It makes routine updates easier to receive, but a snapshot is not automatically as useful for follow-up questions as opening the underlying dashboard. Some products combine the two: a scheduled message can include results or a file and provide a route back to an interactive view.
Which format fits the way you need to work?
| Need | Dashboard | Automated report |
|---|---|---|
| Investigate a change | Usually a better fit when you need to explore filters, details, or changing values. | Less suited to follow-up unless it links to a view you can access. |
| Stay routinely informed | Requires you to open or monitor it unless alerts or subscriptions are configured. | A strong fit when a predictable briefing should arrive at a chosen cadence. |
| Reach different stakeholders | Can support views shaped by roles or permissions. | Convenient for distribution, but confirm each recipient can see the intended data. |
| Know how fresh the data is | Depends on the connected source and the product’s refresh behavior. | Depends on source refresh before sending and any delivery delay. |
| Keep the workflow reliable | Needs a useful layout, stable metric definitions, working access, and monitoring. | Needs those same things, plus an accurate schedule and current recipient list. |
These are decision guidelines, not guarantees that one format improves decisions or saves a particular amount of time.
#1 Best Overall
Why the combination often works best
Use an automated report to surface a small set of results on a routine schedule, then use the dashboard as the place to investigate exceptions. A briefing might tell you that a metric changed; the dashboard can help you examine the trend or the details behind it.
Before relying on an email snapshot, check whether it links to the dashboard and whether recipients are authorized to open that view. For example, Salesforce says scheduled report results depend in part on the access of the report’s running user. A useful-looking attachment does not necessarily mean every recipient can investigate the same data.
What SaaS products document about delivery and limits
These examples describe vendor-documented functionality, not an independently tested comparison. Availability and permissions can depend on the product, edition, configuration, and account.
Do these 3 things before closing this tab:
1Clear out junk files and repair common Windows errors2Scan for outdated or missing drivers - takes under a minute3Repair Windows errors before they cause bigger problemsSalesforce
Salesforce documents dashboard subscriptions that refresh results and email them on a schedule, as well as scheduled reports whose available formats depend on report type and configuration. In Salesforce Classic, scheduled reports can run daily, weekly, or monthly. Permissions, folder access, and the configured running user can affect who may schedule a report and what recipients see. Check the documentation for the Salesforce interface and edition you use: Subscribe to or Schedule Dashboards and Schedule Reports.
HubSpot
HubSpot’s knowledge-base documentation, last updated June 12, 2026, says reports and dashboards can be shared through email, Slack, and Google Chat where configured; recurring report emails can be daily, weekly, or monthly. Some report types cannot be included as email attachments. Check the current sharing and attachment options for your account: Share and export reports and dashboards.
Atlassian Analytics
Atlassian documents dashboard subscriptions that can send PDF copies or CSV files. Its documentation also specifies a 25 MB subscription-file limit, possible delivery delays of up to 60 minutes, and chart refresh behavior: cached data refreshes when expired or older than 30 minutes. These limits and timings are specific to Atlassian Analytics, not a general rule for SaaS reports. See Subscribe to a dashboard.
Rank #4
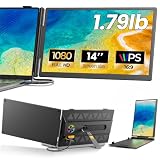
- 𝐀𝐝𝐝 𝐀 𝐒𝐞𝐜𝐨𝐧𝐝 𝐒𝐜𝐫𝐞𝐞𝐧 𝐀𝐧𝐲𝐰𝐡𝐞𝐫𝐞:Expand your laptop with a 14-inch FHD display for documents, email, spreadsheets, video calls, research, streaming, and more. This laptop screen extender supports Extend and Mirror modes, helping remote professionals, students, and travelers reduce tab switching and create a flexible dual-screen workspace at home, in the office, or on the go.
- 𝐃𝐫𝐢𝐯𝐞𝐫-𝐅𝐫𝐞𝐞, 𝐓𝐰𝐨 𝐂𝐨𝐧𝐧𝐞𝐜𝐭𝐢𝐨𝐧 𝐎𝐩𝐭𝐢𝐨𝐧𝐬:No driver is required on compatible devices. Use one USB-C cable only if the port supports DisplayPort Alt Mode video and power. Otherwise, use HDMI-to-Mini HDMI for video plus USB-A-to-USB-C for power. If the screen is dim, flickers, or disconnects, add a 5V/2A or higher adapter, not included. Extra power cannot add video output to a USB-C port without DP Alt Mode. Compatible phones and game consoles require video output support and external power.
- 𝐂𝐥𝐞𝐚𝐫 𝟏𝟒-𝐈𝐧𝐜𝐡 𝐅𝐇𝐃 𝐈𝐏𝐒 𝐃𝐢𝐬𝐩𝐥𝐚𝐲:The 1920 × 1080 anti-glare IPS panel combines a 60Hz refresh rate, 300-nit brightness, 100% sRGB color coverage, and a 1000:1 contrast ratio for clear text, spreadsheets, video calls, and everyday media. Wide viewing angles keep the picture clear from different positions, while the built-in speaker provides convenient everyday audio. Works with Windows, macOS, ChromeOS, Android, and Linux devices that meet the required video-output conditions.
- 𝐋𝐢𝐠𝐡𝐭𝐰𝐞𝐢𝐠𝐡𝐭, 𝐒𝐥𝐢𝐦, 𝐀𝐧𝐝 𝐀𝐝𝐣𝐮𝐬𝐭𝐚𝐛𝐥𝐞:Weighing approximately 1.79 lb and measuring just 0.3 inch at its thinnest point, the A6 portable monitor slips easily into a laptop bag. Its hollow-cut back helps reduce overall weight, while the screen rotates up to 180° and the support stand tilts up to 90° for flexible viewing. Rear-facing ports keep cable paths short and organized. Designed for 13-17.3-inch laptops; check your laptop’s dimensions and available ports before ordering.
- 𝐅𝐨𝐮𝐫 𝐋𝐞𝐝 𝐌𝐨𝐝𝐞𝐬, 𝐓𝐡𝐫𝐞𝐞 𝐂𝐚𝐛𝐥𝐞𝐬 𝐈𝐧𝐜𝐥𝐮𝐝𝐞𝐝, 𝐀𝐧𝐝 𝟏-𝐘𝐞𝐚𝐫 𝐖𝐚𝐫𝐫𝐚𝐧𝐭𝐲:The rear LED light offers four selectable modes. The package includes the A6 monitor, one USB-C-to-USB-C cable, one HDMI-to-Mini HDMI cable, one USB-A-to-USB-C cable, and one user manual, covering both supported connection methods. An external power adapter is not included. Backed by a 1-year warranty and product support through Amazon for compatibility and setup questions.
Other documented approaches
Zoho Analytics describes embedded dashboards, report sharing, scheduled reports, and alerts for SaaS vendors embedding analytics. That is a more specialized use case than choosing a reporting workflow for a typical small-business owner: Zoho Analytics embedded analytics for SaaS.
Microsoft Learn describes Dynamics 365 Business Performance Analytics as a SaaS service with built-in reports and interactive dashboards. The page describes near-real-time refresh as a future-release capability; it does not establish that this capability is currently available. See Business Performance Analytics overview.
Best Value

- [COMPATIBLE REPLACEMENT PART] Designed specifically for CD RDS Radio CD23, this dashboard LCD display fits multiple models including E30, E36, E34, E32, E31, and Z3 for precise compatibility.
- [RESILIENT CONSTRUCTION] Made from robust materials that are anti-corrosive and wear-resistant to for ENSURE durability and longevity in any driving condition.
- [EASY INSTALLATION PROCESS] Installation is straightforward with a replacement design that saves you and hassle while upgrading your vehicle's audio experience.
- [HIGH UNIVERSALITY FITMENT] This display is compatible with various vehicles produced between 1981 and 2003, making it an excellent choice for car enthusiasts looking to restore their dashboard functionality.
- [SIZING REMINDER] Verify OEM numbers against your vehicle's specifications before purchasing to confirm compatibility.
Set up a reporting workflow owners can trust
- Choose a small set of useful metrics. Include measures that help you make or prompt a decision; avoid filling the briefing with numbers no one acts on.
- Agree on metric definitions. Make sure people reading the dashboard and report mean the same thing by each measure and reporting period.
- Check source freshness. Confirm how often connected data updates and whether the report runs after that update. A scheduled email is not proof that its figures are current at the moment it arrives.
- Test the delivered output. Review the actual email or attachment, verify which report types and formats are supported, and confirm that important details are legible.
- Verify recipient access. Check both who receives the report and whether they can open any linked dashboard or see the intended data.
- Review the schedule and recipients periodically. Update them when roles, reporting needs, or business routines change.
HubSpot’s vendor-authored guidance warns that inconsistent structures and declining data quality can undermine confidence in reporting. Treat that as practical vendor advice, not an independently measured finding: HubSpot’s guide to automated reporting.
Quick Recap
Product prices and availability are accurate as of the date/time indicated and are subject to change. Any price and availability information displayed on Amazon at the time of purchase will apply.

