ZoomCharts
ZoomCharts: A focused choice for drill-down, network, and embedded analytics visuals. Ranked #63 of 98 in Data Visualization Software by our editors (3.0/10); pricing: 30-day trial; best for specialized drill-down and network visuals.
At a glance
- Editor score3.0 / 10
- Pricing30-day trial
- Best forSpecialized drill-down and network visuals
- Free planNo
- Embedded dashboardsYes
- Founded2013 · Riga, Latvia
- Facts checked21 Sep 2026
Where it wins
- Interactive drill-down and cross-filtering across visuals
- Power BI custom visuals plus embeddable JavaScript charts
- Maps, timelines, networks, and large-dataset support
Where it doesn't
- No free plan; access is paid after the 30-day trial
- Broader products use separate licensing and pricing models
- More specialized than a complete visualization suite
Our verdict on ZoomCharts
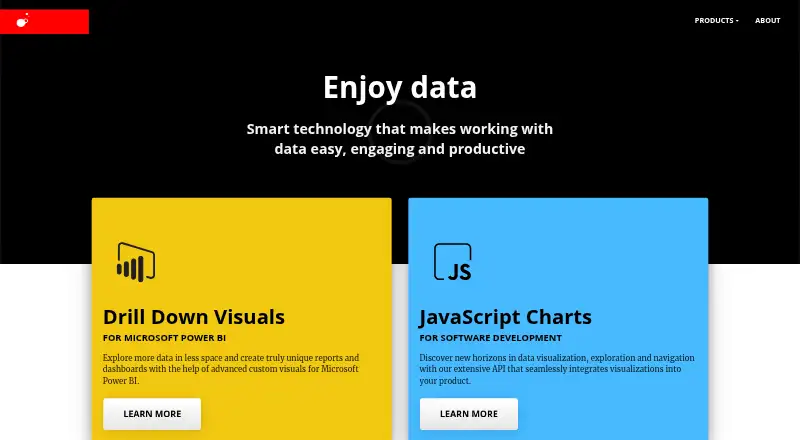
ZoomCharts is a paid data-visualization product suite for software teams and business intelligence users. Its offerings include Drill Down custom visuals for Microsoft Power BI and an embeddable JavaScript chart library for web applications and analytics platforms. The suite covers interactive maps, timelines, time-series charts, networks, graphs, scatter plots, and waterfalls, with support for Power BI reports and dashboards, custom visual development, and large datasets. It is a strong fit for teams that need focused analytical visuals rather than a general-purpose visualization platform.
The published plans separate usage by deployment and audience. The Single custom visual plan provides one Power BI custom visual, while the Full visual bundle provides the full bundle of Drill Down Visuals. Developer-only licensing is intended for Power BI report developers, and capacity-based licensing is available for Power BI capacity deployments. Other options cover external viewers and public websites, as well as enterprise deployments. The published starting price is 0.99 for a single Power BI custom visual, and a 30-day free trial is available. The JavaScript SDK and other products use separate licensing and pricing models, so buyers should match the plan to their distribution model before choosing.
ZoomCharts fits ecosystems built around Microsoft Power BI, web applications, or JavaScript development. Integrations and development connections include React, Vue, Angular, PHP, Node.js, TypeScript, MongoDB, MySQL, Microsoft SQL Server, and Neo4j. Cloud, desktop, and browser-extension deployment options are listed, alongside email, chat, phone, and documentation support. Two-factor authentication is included in the stated compliance features. Choose ZoomCharts when drill-down interaction, cross-filtering, geographic views, timelines, or network visuals are central requirements. Choose an alternative when you need a broader visualization suite with a single pricing structure across all products.
Your product? Our editors can test ZoomCharts in depth and publish a review, labelled as paid · from $149/mo →
ZoomCharts pricing
All 6 ZoomCharts plans and prices →
ZoomCharts fact sheet
| Free plan | No |
|---|---|
| Paid from | Not verified |
| Dashboard type | Interactive |
| Scheduled refresh | Not verified |
| Embedded dashboards | Yes |
| Data sources | MongoDB, MySQL, Microsoft SQL Server, Neo4j |
| Viewer limit | Not verified |
| Platform | Web_and_desktop |
| Free trial | 30 days |
| Money-back guarantee | 7 days |
| Deployment | Cloud, Desktop, Browser extension |
| Platforms | Web, Windows |
| Compliance & security | 2FA |
| Support | Email, Live chat, Phone, Docs |
| Built for | Small business, Mid-market, Enterprise (editorial estimate) |
| Integrations | 11 integrations: Microsoft Power BI, React, Vue, Angular, MongoDB, MySQL … |
| Pricing | 30-day trial (source) |
| Website | zoomcharts.com |
| Facts checked | 21 Sep 2026 |
ZoomCharts integrations
ZoomCharts lists 11 integrations on its own site.
- Microsoft Power BI
- React
- Vue
- Angular
- MongoDB
- MySQL
- Microsoft SQL Server
- Neo4j
- PHP
- Node.js
- TypeScript
Alternatives to ZoomCharts
- TableauA broad BI platform for governed analytics, visualization, and embedded insights.9.4
- Data StudioA low-cost cloud dashboard tool with broad connectors and useful sharing controls.9.2
- LookerA governed analytics platform for teams that need consistent metrics and embedded insights.9.1



See all ZoomCharts alternatives →
Used ZoomCharts? Be the first to review it
The editor score above is our own research. What this page doesn't have yet is a reader's view — what you used ZoomCharts for, what worked and what didn't. No stars are seeded and no review is paid for; an editor reads every one before it appears.
Write a reviewTwo minutes · verified accounts only · read by an editor before it appears
Featured on iTechGuides

ZoomCharts is listed in our Data Visualization Software directory. Add the badge to your site — it links back to this page.
<a href="https://www.itechguides.com/products/zoomcharts/"><img src="https://www.itechguides.com/best/badge/zoomcharts.svg" alt="Featured on iTechGuides" width="230" height="46"></a>
Reviewed by iTechGuides Editors · Editorial team · Updated Oct 2026
Advertiser disclosure: iTechGuides is reader-supported. Vendors can pay for top positions in our rankings and for a place on other products' pages, and we may earn a commission when you click some links. Bought places stand at the number bought; this page and our disclosure say so. Paying vendors may get a fuller, more detailed review from our editors, and that review can change their score. How we rank.
Last updated · How we research and update