widgyts
widgyts: A focused open-source toolkit for exploring yt and mesh-based data in Jupyter. Ranked #82 of 98 in Data Visualization Software by our editors (3.0/10); pricing: Free plan; best for jupyter users visualizing yt mesh and AMR data.
At a glance
- Editor score3.0 / 10
- PricingFree plan
- Best forJupyter users visualizing yt mesh and AMR data
- Free planYes
- Paid fromFree
- Facts checked23 Sep 2026
Where it wins
- Interactive browser-based pan and zoom uses WebAssembly.
- Offers AMR grid, variable-mesh, and particle visualization.
- Links widget instances with Traitlets and supports yt notebook views.
Where it doesn't
- Focused on scientific mesh and AMR datasets, not general dashboards.
- Requires installation into a Jupyter environment.
- Support is through community and documentation.
Our verdict on widgyts
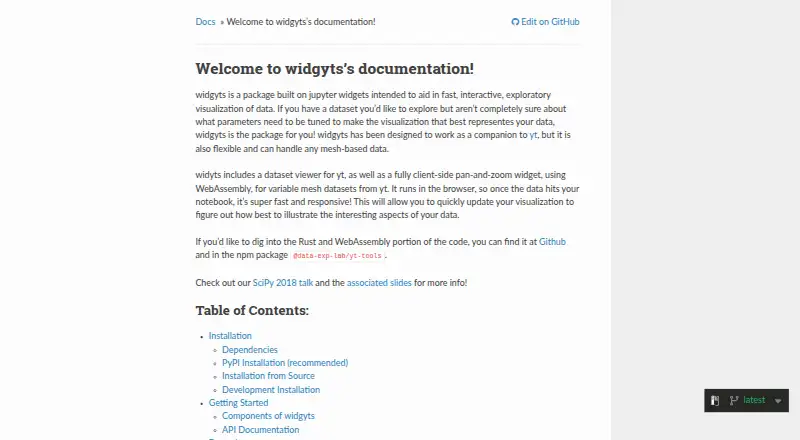
widgyts is an open-source Jupyter widget package for exploratory visualization of scientific datasets. It is designed as a companion to yt, while also supporting mesh-based data without importing yt. Its audience is researchers and developers working with yt datasets, AMR grids, and variable meshes who want interactive views in notebooks rather than a hosted dashboard product. The published package is installed into a Jupyter environment, and its platform scope includes web and self-hosted use.
The feature set centers on inspecting scientific data in context. A dataset summary viewer presents metadata and fields, while a basic 3D grid viewer handles AMR datasets. ImageCanvas and FRBViewer widgets provide variable-mesh visualization with pan, zoom, and color-map controls; basic particle visualization is also supported for AMR data. Widgyts can display yt slices and projections interactively in notebooks. The variable-mesh view runs client-side in the browser using WebAssembly once data is available in the notebook, and Traitlet linking can synchronize widget instances. These capabilities fit exploratory workflows where interactive inspection matters more than broad dashboard construction.
The package is free and open source, with community and documentation as its support channels. Its narrow focus is also the main trade-off: it is not positioned as a hosted commercial dashboard, and its viewers are tailored to yt, mesh, and AMR data rather than general-purpose visualization needs. Jupyter users who already work with these datasets should find the scope relevant; teams seeking a broader dashboard platform or hosted service should consider a different type of product.
Your product? Our editors can test widgyts in depth and publish a review, labelled as paid · from $149/mo →
widgyts pricing
widgyts fact sheet
| Free plan | Yes |
|---|---|
| Paid from | Free |
| Dashboard type | Interactive |
| Scheduled refresh | Not verified |
| Embedded dashboards | Not verified |
| Data sources | yt datasets; mesh-based data |
| Viewer limit | Not verified |
| Platform | Web |
| Deployment | Self-hosted, Browser extension |
| Platforms | Web |
| Support | Community, Docs |
| Built for | Solo, Small business (editorial estimate) |
| Integrations | 3 integrations: yt, Jupyter, ipywidgets |
| Pricing | Free plan |
| Website | widgyts.readthedocs.io |
| Facts checked | 23 Sep 2026 |
widgyts integrations
widgyts lists 3 integrations on its own site.
- yt
- Jupyter
- ipywidgets
Alternatives to widgyts
- TableauA broad BI platform for governed analytics, visualization, and embedded insights.9.4
- Data StudioA low-cost cloud dashboard tool with broad connectors and useful sharing controls.9.2
- LookerA governed analytics platform for teams that need consistent metrics and embedded insights.9.1



See all widgyts alternatives →
Used widgyts? Be the first to review it
The editor score above is our own research. What this page doesn't have yet is a reader's view — what you used widgyts for, what worked and what didn't. No stars are seeded and no review is paid for; an editor reads every one before it appears.
Write a reviewTwo minutes · verified accounts only · read by an editor before it appears
Featured on iTechGuides

widgyts is listed in our Data Visualization Software directory. Add the badge to your site — it links back to this page.
<a href="https://www.itechguides.com/products/widgyts/"><img src="https://www.itechguides.com/best/badge/widgyts.svg" alt="Featured on iTechGuides" width="230" height="46"></a>
Reviewed by iTechGuides Editors · Editorial team · Updated Oct 2026
Advertiser disclosure: iTechGuides is reader-supported. Vendors can pay for top positions in our rankings and for a place on other products' pages, and we may earn a commission when you click some links. Bought places stand at the number bought; this page and our disclosure say so. Paying vendors may get a fuller, more detailed review from our editors, and that review can change their score. How we rank.
Last updated · How we research and update