Vizumap
Vizumap: A focused R toolkit for mapping statistical estimates alongside their uncertainty. Ranked #79 of 98 in Data Visualization Software by our editors (3.0/10); pricing: Free plan; best for researchers mapping estimates and uncertainty.
At a glance
- Editor score3.0 / 10
- PricingFree plan
- Best forResearchers mapping estimates and uncertainty
- Free planYes
- Paid fromFree
- Facts checked23 Sep 2026
Where it wins
- Combines statistical estimates and uncertainty in bivariate maps
- Offers pixel, animated pixel, glyph, and exceedance-probability maps
- Includes map-key functions and a bundled pollutant-prediction example
Where it doesn't
- Focused on spatial uncertainty mapping rather than general-purpose visualization
- Requires working with R and tabular and geographic data
- It is a package, not a hosted dashboard product
Our verdict on Vizumap
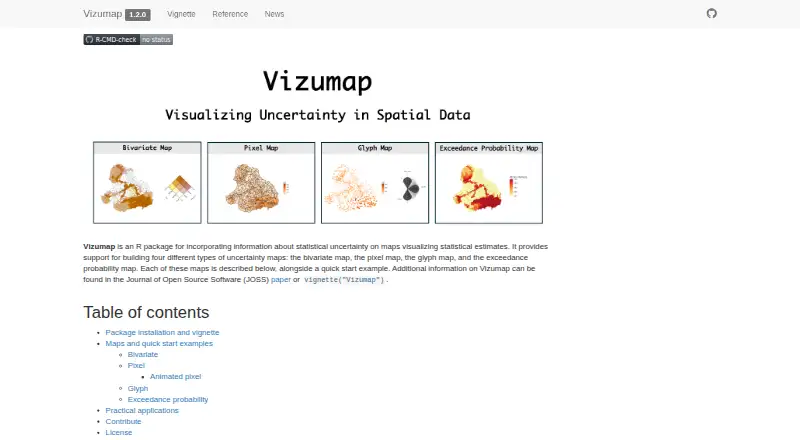
Vizumap is an open-source R package for people who analyze spatial data and need to communicate statistical estimates with their uncertainty. Its functions cover several ways to represent that uncertainty on maps: bivariate maps combine estimates and uncertainty, while pixel maps encode sampled values from confidence or credible intervals. The package also creates animated pixel maps, glyph maps, and exceedance-probability maps. This makes it a specialized option for researchers and analysts whose work involves geographic estimates, rather than a general-purpose dashboard or charting product.
The mapping choices are Vizumap’s main distinction. Pixel maps show variation across confidence or credible intervals, and animation uses flickering to visualize uncertainty. Glyph maps pair color for estimates with rotation for uncertainty; exceedance-probability maps address thresholds of concern. Users can also build map keys and attach them to maps. A bundled example dataset combines pollutant predictions with geographic data for the Burdekin catchment, offering a documented context for the package’s mapping approach. These methods are useful when a single estimate-only map would not convey the uncertainty that matters to an analysis.
The published project information describes an R package, with installation from GitHub and GPLv3 licensing, not a hosted dashboard service. Its documented inputs include data frames and geographic data such as shapefiles. That focus suits researchers already working in R with spatial data, but is less apt for teams seeking a visual interface, scheduled data refreshes, or a broad business intelligence workflow. Choose Vizumap when uncertainty representation is central to a spatial analysis; look elsewhere if the primary need is an all-purpose visualization environment or hosted dashboard.
Your product? Our editors can test Vizumap in depth and publish a review, labelled as paid · from $149/mo →
Vizumap pricing
Vizumap fact sheet
| Free plan | Yes |
|---|---|
| Paid from | Free |
| Dashboard type | Not verified |
| Scheduled refresh | No |
| Embedded dashboards | Not verified |
| Data sources | Data frames and geographic data including shapefiles; bundled Burdekin example data |
| Viewer limit | Not verified |
| Platform | Not verified |
| Pricing | Free plan |
| Website | lydialucchesi.github.io |
| Facts checked | 23 Sep 2026 |
Alternatives to Vizumap
- TableauA broad BI platform for governed analytics, visualization, and embedded insights.9.4
- Data StudioA low-cost cloud dashboard tool with broad connectors and useful sharing controls.9.2
- LookerA governed analytics platform for teams that need consistent metrics and embedded insights.9.1



See all Vizumap alternatives →
Used Vizumap? Be the first to review it
The editor score above is our own research. What this page doesn't have yet is a reader's view — what you used Vizumap for, what worked and what didn't. No stars are seeded and no review is paid for; an editor reads every one before it appears.
Write a reviewTwo minutes · verified accounts only · read by an editor before it appears
Featured on iTechGuides

Vizumap is listed in our Data Visualization Software directory. Add the badge to your site — it links back to this page.
<a href="https://www.itechguides.com/products/vizumap/"><img src="https://www.itechguides.com/best/badge/vizumap.svg" alt="Featured on iTechGuides" width="230" height="46"></a>
Reviewed by iTechGuides Editors · Editorial team · Updated Oct 2026
Advertiser disclosure: iTechGuides is reader-supported. Vendors can pay for top positions in our rankings and for a place on other products' pages, and we may earn a commission when you click some links. Bought places stand at the number bought; this page and our disclosure say so. Paying vendors may get a fuller, more detailed review from our editors, and that review can change their score. How we rank.
Last updated · How we research and update