
Visualis
Visualis: A quick, collaborative browser tool for turning spreadsheets and CSV files into visualizations. Ranked #65 of 98 in Data Visualization Software by our editors (3.0/10); pricing: Free plan; best for small teams making quick collaborative visualizations.
At a glance
- Editor score3.0 / 10
- PricingFree plan
- Best forSmall teams making quick collaborative visualizations
- Free planYes
- Facts checked22 Sep 2026
Where it wins
- Imports CSVs, spreadsheets, pasted data and manual entries
- Supports filtering, grouping, pivoting, maps and customizable charts
- Offers collaboration, sharing and exports in several formats
Where it doesn't
- Runs only in a web browser
- Documented integrations are limited to CSV and external spreadsheets
- The service is described as beta, with limited maturity evidence
Our verdict on Visualis
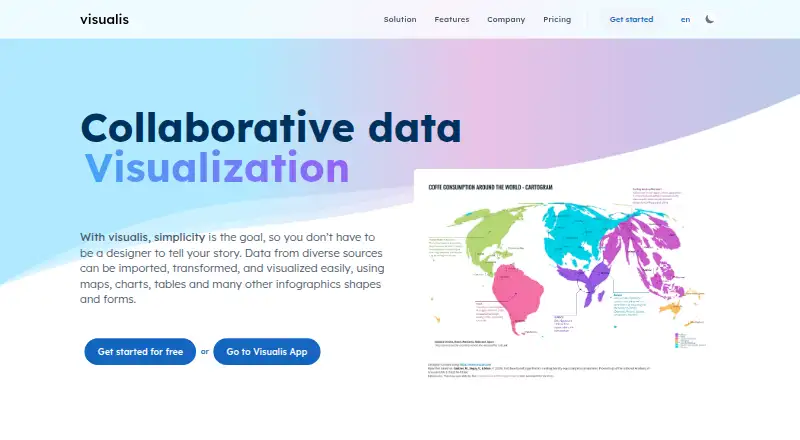
Visualis is a browser-based data visualization application for individuals, professionals and teams. It brings CSV files, external spreadsheets, clipboard data and manually entered values into a workspace for creating charts, maps, tables, infographics and reports. Its feature set is suited to small teams that need to turn working data into shareable visuals without adopting a broader analytics platform.
The free plan supports visualization creation and publishing, includes three uploaded data sources, and exports visualizations as PNG. The Teams plan includes all Free features plus collaboration, additional data sources, additional formats and no watermark. The published plans therefore give small groups a clear path from individual or lightweight work to shared projects, although the practical value of Teams depends on how many sources and export options a team needs. Visualis is offered as a cloud service with email support.
Its strongest workflow is the combination of basic data transformation and presentation: users can filter, group and pivot data, build interactive maps and customize charts before sharing or exporting. Available export formats include PDF, PNG, SVG, HTML and Gzip, which supports both document-oriented and web-oriented delivery. The trade-off is a narrow documented ecosystem: Visualis is web-only, and its listed inputs center on CSV files, external spreadsheets, clipboard content and keyboard entry. Teams wanting quick collaborative visualizations should consider it, while buyers needing broad integrations, mature enterprise signals or a wider deployment footprint should look elsewhere.
Your product? Our editors can test Visualis in depth and publish a review, labelled as paid · from $149/mo →
Visualis pricing
All 2 Visualis plans and prices →
Visualis fact sheet
| Free plan | Yes |
|---|---|
| Paid from | Not verified |
| Dashboard type | Not verified |
| Scheduled refresh | Not verified |
| Embedded dashboards | Not verified |
| Data sources | CSV files; external spreadsheets; clipboard; keyboard input |
| Viewer limit | Not verified |
| Platform | Web |
| Deployment | Cloud |
| Platforms | Web |
| Support | |
| Built for | Solo, Small business, Mid-market (editorial estimate) |
| Pricing | Free plan (source) |
| Website | visualis.one |
| Facts checked | 22 Sep 2026 |
Alternatives to Visualis
- TableauA broad BI platform for governed analytics, visualization, and embedded insights.9.4
- Data StudioA low-cost cloud dashboard tool with broad connectors and useful sharing controls.9.2
- LookerA governed analytics platform for teams that need consistent metrics and embedded insights.9.1



See all Visualis alternatives →
Used Visualis? Be the first to review it
The editor score above is our own research. What this page doesn't have yet is a reader's view — what you used Visualis for, what worked and what didn't. No stars are seeded and no review is paid for; an editor reads every one before it appears.
Write a reviewTwo minutes · verified accounts only · read by an editor before it appears
Featured on iTechGuides

Visualis is listed in our Data Visualization Software directory. Add the badge to your site — it links back to this page.
<a href="https://www.itechguides.com/products/visualis/"><img src="https://www.itechguides.com/best/badge/visualis.svg" alt="Featured on iTechGuides" width="230" height="46"></a>
Reviewed by iTechGuides Editors · Editorial team · Updated Oct 2026
Advertiser disclosure: iTechGuides is reader-supported. Vendors can pay for top positions in our rankings and for a place on other products' pages, and we may earn a commission when you click some links. Bought places stand at the number bought; this page and our disclosure say so. Paying vendors may get a fuller, more detailed review from our editors, and that review can change their score. How we rank.
Last updated · How we research and update