
Tulip
Tulip: A free, open-source desktop framework for exploring and analyzing graph data. Ranked #66 of 98 in Data Visualization Software by our editors (4.2/10); pricing: Free plan; best for researchers exploring and analyzing graph data.
At a glance
- Editor score4.2 / 10
- PricingFree plan
- Best forResearchers exploring and analyzing graph data
- Free planYes
- Paid fromNone
- Facts checked23 Sep 2026
Where it wins
- Interactive graph exploration with filtering, selection and navigation
- Multiple graph views, including matrices, histograms and scatter plots
- Python scripting and plugins extend graph workflows
Where it doesn't
- Primarily distributed as source code; precompiled binaries are no longer provided
- Focused on graph analysis rather than general-purpose data visualization
- Documentation is the listed support channel
Our verdict on Tulip
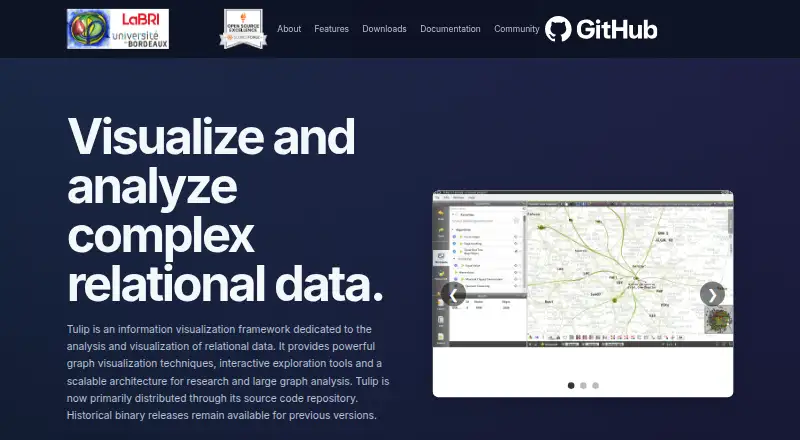
Tulip is a cross-platform framework for visualizing and analyzing relational data, particularly graphs. Its interactive rendering, layout algorithms and graph exploration tools suit researchers and developers studying graph structures. It is available as open-source software for desktop use on Windows, macOS and Linux, and its source code can be built for those platforms. The focus is specialized: teams seeking broad business dashboards or general-purpose visualization may find a graph-oriented tool a poor fit.
Graph analysis is the product’s center of gravity. Users can filter, select and navigate graph structures, apply clustering and metric algorithms, and view data through matrices, histograms, scatter plots and parallel coordinates. Hierarchical graphs and nested subgraphs support work with complex structures. Graph import and export, serialization, and layout algorithms provide additional control over graph workflows. This makes Tulip more suitable for investigation and analysis of relational data than for presenting a conventional dashboard to a broad audience.
Extensibility is another reason to consider it: Python bindings and scripting can support custom workflows, while plugins can add graph import options, algorithms and visualization components. Tulip is open source and free, with no paid tiers described. A practical consideration is distribution: the project says it no longer provides precompiled binaries, so prospective users should be comfortable building from source. Documentation is the listed support channel. Researchers and developers who need an extensible desktop graph-analysis environment may find that tradeoff appropriate; users who want general-purpose visualization or ready-to-install binaries should look elsewhere.
Tulip pricing
Tulip fact sheet
| Free plan | Yes |
|---|---|
| Paid from | None |
| Dashboard type | Interactive |
| Scheduled refresh | Not verified |
| Embedded dashboards | Not verified |
| Data sources | CSV; TLP; TLP binary; other graph formats are referenced, but not enumerated on the opened official pages |
| Viewer limit | Not verified |
| Platform | Desktop |
| Deployment | Desktop, Self-hosted |
| Platforms | Windows, macOS, Linux |
| Support | Docs |
| Built for | Solo, Small business, Mid-market, Enterprise (editorial estimate) |
| Integrations | 1 integrations: Python |
| Pricing | Free plan |
| Website | tulip.labri.fr |
| Facts checked | 23 Sep 2026 |
Tulip integrations
Tulip lists 1 integrations on its own site.
- Python
Alternatives to Tulip
- TableauA broad BI platform for governed analytics, visualization, and embedded insights.9.0
- Data StudioA low-cost cloud dashboard tool with broad connectors and useful sharing controls.8.4
- PlotlyA flexible choice for developers building interactive charts, maps, dashboards, and data apps.7.7


Also listed in
Used Tulip? Be the first to review it
The editor score above is our own research. What this page doesn't have yet is a reader's view — what you used Tulip for, what worked and what didn't. No stars are seeded and no review is paid for; an editor reads every one before it appears.
Write a reviewTwo minutes · verified accounts only · read by an editor before it appears
Featured on iTechGuides

Tulip is listed in our Data Visualization Software directory. Add the badge to your site — it links back to this page.
<a href="https://www.itechguides.com/products/tulip-data-visualization-tool/"><img src="https://www.itechguides.com/best/badge/tulip-data-visualization-tool.svg" alt="Featured on iTechGuides" width="230" height="46"></a>
Guides on data visualization software
- 8 Best Data Visualization Tools (Free & Paid Software)Aug 2026
- Power BI vs Tableau: Compare Top Data Visualization ToolsAug 2026
- How to Use Excel as a Data Visualization Tool: Charts, Dashboards, Maps, and MoreAug 2026
Reviewed by iTechGuides Editors · Editorial team · Updated Sep 2026
Advertiser disclosure: iTechGuides is reader-supported. We may earn a commission when you click some links. It never changes a score or a verdict. How we rank.
Last updated · How we research and update