
psyplot
psyplot: A scientific Python toolkit for interactive plots, geospatial data, and command-line workflows. Ranked #71 of 98 in Data Visualization Software by our editors (3.0/10); pricing: Free plan; best for scientists plotting multidimensional geospatial data.
At a glance
- Editor score3.0 / 10
- PricingFree plan
- Best forScientists plotting multidimensional geospatial data
- Free planYes
- Paid fromFree
- Facts checked24 Sep 2026
Where it wins
- Combines Python APIs, command-line plotting, and graphical interfaces
- Decodes CF and UGRID conventions for scientific data workflows
- Plugins add maps, vectors, density plots, and other methods
Where it doesn't
- Desktop-oriented deployment does not suit browser-first workflows
- Its focus on Python and xarray-readable scientific data narrows its scope
- Some plot types depend on the plugin architecture
Our verdict on psyplot
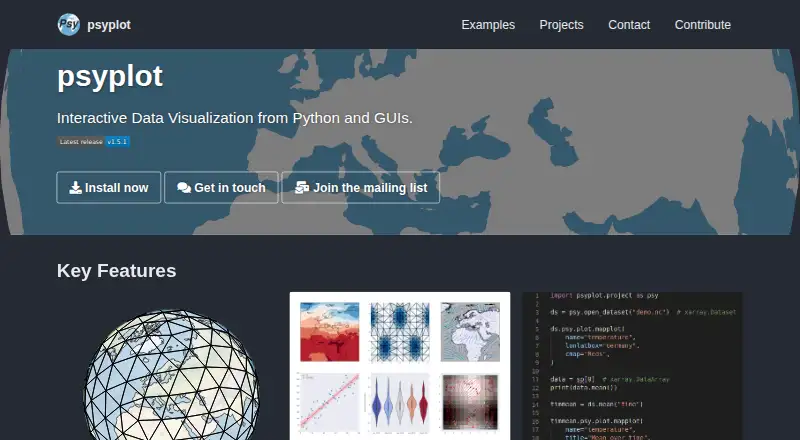
psyplot is an open-source Python visualization framework that combines matplotlib plotting with xarray data management. It is aimed at scientific users who work with multidimensional datasets, including netCDF and other formats readable by xarray. Interactive Python APIs support scriptable plotting, while command-line workflows and graphical interfaces via psyplot-gui and psy-view offer other ways to explore data. Its desktop orientation makes it a closer fit for research and analysis workflows than for teams seeking a browser-based visualization service.
Scientific data handling is a notable strength. psyplot decodes CF and UGRID conventions and provides one- and two-dimensional plotting methods. Plugins extend the available methods to include maps, vector plots, line plots, density plots, and violin plots. psy-view can export plots to common image formats and create animations. This combination suits scientists who need to examine geospatial or other structured data and want Python-based control over their plots. The plugin model also means the available plotting methods are tied to the extensions in use, so buyers should consider their required plot types when evaluating the toolkit.
The project is freely available and open source, with installation options including conda, pip, or source. That makes it a practical option for individuals and teams comfortable with a Python-centered workflow and desktop tools. Its category fit is narrower than general-purpose visualization products: the emphasis is scientific data, and the product is described as desktop-oriented with limited integrations. Researchers seeking interactive, extensible plots for xarray-readable data should consider psyplot; teams prioritizing a broad connected ecosystem or browser-first dashboards should look elsewhere.
Your product? Our editors can test psyplot in depth and publish a review, labelled as paid · from $149/mo →
psyplot pricing
psyplot fact sheet
| Free plan | Yes |
|---|---|
| Paid from | Free |
| Dashboard type | Interactive |
| Scheduled refresh | Not verified |
| Embedded dashboards | Not verified |
| Data sources | netCDF, GRIB, GeoTIFF and other formats supported by xarray |
| Viewer limit | Not verified |
| Platform | Desktop |
| Deployment | Desktop |
| Support | Live chat, Community, Tickets, Docs |
| Built for | Solo, Small business, Mid-market, Enterprise (editorial estimate) |
| Pricing | Free plan |
| Website | psyplot.github.io |
| Facts checked | 24 Sep 2026 |
Alternatives to psyplot
- TableauA broad BI platform for governed analytics, visualization, and embedded insights.9.4
- Data StudioA low-cost cloud dashboard tool with broad connectors and useful sharing controls.9.2
- LookerA governed analytics platform for teams that need consistent metrics and embedded insights.9.1



See all psyplot alternatives →
Used psyplot? Be the first to review it
The editor score above is our own research. What this page doesn't have yet is a reader's view — what you used psyplot for, what worked and what didn't. No stars are seeded and no review is paid for; an editor reads every one before it appears.
Write a reviewTwo minutes · verified accounts only · read by an editor before it appears
Featured on iTechGuides

psyplot is listed in our Data Visualization Software directory. Add the badge to your site — it links back to this page.
<a href="https://www.itechguides.com/products/psyplot/"><img src="https://www.itechguides.com/best/badge/psyplot.svg" alt="Featured on iTechGuides" width="230" height="46"></a>
Reviewed by iTechGuides Editors · Editorial team · Updated Oct 2026
Advertiser disclosure: iTechGuides is reader-supported. Vendors can pay for top positions in our rankings and for a place on other products' pages, and we may earn a commission when you click some links. Bought places stand at the number bought; this page and our disclosure say so. Paying vendors may get a fuller, more detailed review from our editors, and that review can change their score. How we rank.
Last updated · How we research and update