
Matplotlib
Matplotlib: A highly customizable Python plotting library for charts, notebooks, and scientific work. Ranked #8 of 98 in Data Visualization Software by our editors (8.4/10); pricing: Free plan; best for python users creating publication-quality plots.
At a glance
- Editor score8.4 / 10
- PricingFree plan
- Best forPython users creating publication-quality plots
- Free planYes
- Paid fromFree
- Embedded dashboardsYes
- Founded2003
- Facts checked21 Sep 2026
Where it wins
- Publication-quality plots with extensive visual customization
- Supports static, animated, and interactive visualizations
- Exports to PNG, SVG, PDF, and PS formats
Where it doesn't
- Requires Python-based plotting rather than a no-code workflow
- Not positioned as a hosted dashboard service
- No published scheduling or collaboration features
Our verdict on Matplotlib
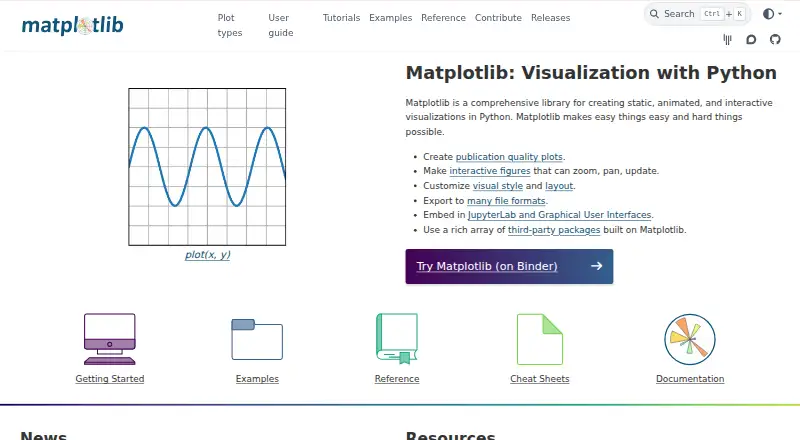
Matplotlib is an open-source Python library for creating static, animated, and interactive visualizations. It is aimed at Python developers, researchers, analysts, and scientific computing teams that need programmable charting and plotting. Its supported plot types include lines, bars, scatter plots, images, contours, statistics, and 3D plots. Data can come from Python lists and NumPy arrays, while outputs can be embedded in Jupyter notebooks, graphical user interfaces, and web applications.
Its main strength is depth in chart creation and visual control. Interactive figures support pan, zoom, and event handling, while customizable styles and layouts help users produce publication-quality results. Matplotlib can export charts to PNG, SVG, PDF, and PS formats. GUI backends cover Qt, GTK, Tk, wxPython, and macOS, and a web application backend supports dynamically served graphs. This breadth makes it suitable when chart behavior, rendering, and output format need to be handled directly in Python.
Matplotlib is available as open-source software rather than as a hosted dashboard product with paid tiers. It fits teams that want a programmable plotting foundation across web and desktop environments, especially for notebooks, analysis workflows, and scientific visualization. It is less suited to organizations seeking a ready-made dashboard service with scheduled refreshes, commercial integrations, viewer quotas, or built-in collaboration features. Choose it for control and plotting range; consider an alternative when dashboard operations and team-facing distribution are the primary requirements.
Your product? Our editors can test Matplotlib in depth and publish a review, labelled as paid · from $149/mo →
Matplotlib pricing
Matplotlib fact sheet
| Free plan | Yes |
|---|---|
| Paid from | Free |
| Dashboard type | Both |
| Scheduled refresh | Not verified |
| Embedded dashboards | Yes |
| Data sources | Python lists, NumPy arrays |
| Viewer limit | Not verified |
| Platform | Web_and_desktop |
| Deployment | Self-hosted, Desktop |
| Platforms | Web, Windows, macOS, Linux |
| Support | Community, Docs |
| Built for | Solo, Small business, Mid-market, Enterprise (editorial estimate) |
| Pricing | Free plan |
| Website | matplotlib.org |
| Facts checked | 21 Sep 2026 |
Alternatives to Matplotlib
- TableauA broad BI platform for governed analytics, visualization, and embedded insights.9.4
- Data StudioA low-cost cloud dashboard tool with broad connectors and useful sharing controls.9.2
- LookerA governed analytics platform for teams that need consistent metrics and embedded insights.9.1



See all Matplotlib alternatives →
Matplotlib vs the competition
- Matplotlib vs Tableau
- Matplotlib vs Data Studio
- Matplotlib vs Looker
- Matplotlib vs Apache Superset
- Matplotlib vs Metabase
- Matplotlib vs Plotly



Compare Matplotlib with any tool side by side →
Also Ranked In
Matplotlib is ranked in 2 of our directories.
Used Matplotlib? Be the first to review it
The editor score above is our own research. What this page doesn't have yet is a reader's view — what you used Matplotlib for, what worked and what didn't. No stars are seeded and no review is paid for; an editor reads every one before it appears.
Write a reviewTwo minutes · verified accounts only · read by an editor before it appears
Featured on iTechGuides

Matplotlib is listed in our Data Visualization Software directory. Add the badge to your site — it links back to this page.
<a href="https://www.itechguides.com/products/matplotlib/"><img src="https://www.itechguides.com/best/badge/matplotlib.svg" alt="Featured on iTechGuides" width="230" height="46"></a>
Reviewed by iTechGuides Editors · Editorial team · Updated Oct 2026
Advertiser disclosure: iTechGuides is reader-supported. Vendors can pay for top positions in our rankings and for a place on other products' pages, and we may earn a commission when you click some links. Bought places stand at the number bought; this page and our disclosure say so. Paying vendors may get a fuller, more detailed review from our editors, and that review can change their score. How we rank.
Last updated · How we research and update