
FusionCharts
FusionCharts: A broad charting and mapping library for teams building data-rich applications. Ranked #69 of 98 in Data Visualization Software by our editors (3.0/10); pricing: Paid; best for high-volume charting and map applications.
At a glance
- Editor score3.0 / 10
- PricingPaid
- Best forHigh-volume charting and map applications
- Free planNo
- Paid from$1,899/unit/yr
- Embedded dashboardsYes
- Founded2002 · Austin, Texas, United States
- Facts checked22 Sep 2026
Where it wins
- 100+ chart types and 2,000+ data-driven maps
- Interactive dashboards, drill-downs, annotations, and exports
- Integrations across major web and mobile frameworks
Where it doesn't
- No unlimited free plan is offered
- Pro licensing starts at $1,899 per license annually
- Licensing is based on developers and applications, not viewers
Our verdict on FusionCharts
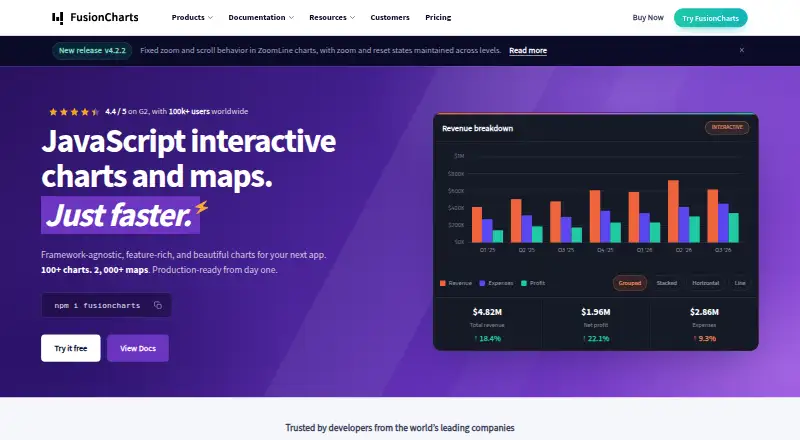
FusionCharts is a developer-focused visualization library for building interactive charts, dashboards, maps, timelines, grids, and reporting interfaces. It is designed for teams creating internal applications, embedded analytics, SaaS products, and enterprise software across web, iOS, and Android deployments. The feature set covers real-time data streaming charts, drill-downs, annotations, interactive legends, grid operations, scheduled refreshes, embedding, and exports to image, SVG, and PDF formats.
Pricing is structured around developers and applications rather than the number of people viewing charts. The Free Trial lets teams evaluate FusionCharts before purchasing a license. The annual Pro plan costs $1,899 per license for up to 5 developers and one product, with internal apps and customer on-premise applications covered, plus one year of updates and technical support. A one-time Pro license costs $4,799 with the same developer and application limits. Enterprise costs $3,399 per license annually for up to 10 developers and adds SaaS applications and on-premise redistribution; its one-time license costs $8,399. Enterprise+ uses custom organizational licensing for more than 10 developers.
Its ecosystem coverage is a major strength. FusionCharts integrates with JavaScript, React, Angular, Vue, Svelte, jQuery, Ember, React Native, Flutter, Blazor, ASP.NET, PHP, Java, Python, and Django. Data can come from REST APIs, JSON, XML, CSV, databases, feeds, and structured data. That breadth suits products needing many chart formats, maps, reporting controls, and framework options. Teams seeking a narrow charting component, an unlimited free plan, or lower-cost entry should consider an alternative; FusionCharts is better suited to organizations that can justify paid licensing for broad visualization requirements.
Your product? Our editors can test FusionCharts in depth and publish a review, labelled as paid · from $149/mo →
FusionCharts pricing
All 4 FusionCharts plans and prices →
FusionCharts fact sheet
| Free plan | No |
|---|---|
| Paid from | $1,899/unit/yr |
| Dashboard type | Interactive |
| Scheduled refresh | Yes |
| Embedded dashboards | Yes |
| Data sources | REST APIs, JSON, XML, CSV, databases, feeds, and structured data |
| Viewer limit | Not verified |
| Platform | Web |
| Deployment | Self-hosted, Desktop, Mobile |
| Platforms | Web, iOS, Android |
| Support | Email, Live chat, Phone, Tickets, Community, Docs |
| Built for | Small business, Mid-market, Enterprise (editorial estimate) |
| Integrations | 20 integrations: JavaScript, React, Angular, Vue, Svelte, jQuery … See all → |
| Pricing | Paid (source) |
| Website | fusioncharts.com |
| Facts checked | 22 Sep 2026 |
FusionCharts integrations
FusionCharts lists 20 integrations on its own site.
- JavaScript
- React
- Angular
- Vue
- Svelte
- jQuery
- Ember
- React Native
- Flutter
- Blazor
- ASP.NET
- PHP
- Java
- Python
- Django
- Ruby on Rails
- REST APIs
- CSV
- XML
- JSON
See all FusionCharts integrations →
Alternatives to FusionCharts
- TableauA broad BI platform for governed analytics, visualization, and embedded insights.9.4
- Data StudioA low-cost cloud dashboard tool with broad connectors and useful sharing controls.9.2
- LookerA governed analytics platform for teams that need consistent metrics and embedded insights.9.1



See all FusionCharts alternatives →
Also Ranked In
FusionCharts is ranked in 2 of our directories.
Used FusionCharts? Be the first to review it
The editor score above is our own research. What this page doesn't have yet is a reader's view — what you used FusionCharts for, what worked and what didn't. No stars are seeded and no review is paid for; an editor reads every one before it appears.
Write a reviewTwo minutes · verified accounts only · read by an editor before it appears
Featured on iTechGuides

FusionCharts is listed in our Data Visualization Software directory. Add the badge to your site — it links back to this page.
<a href="https://www.itechguides.com/products/fusioncharts/"><img src="https://www.itechguides.com/best/badge/fusioncharts.svg" alt="Featured on iTechGuides" width="230" height="46"></a>
Reviewed by iTechGuides Editors · Editorial team · Updated Oct 2026
Advertiser disclosure: iTechGuides is reader-supported. Vendors can pay for top positions in our rankings and for a place on other products' pages, and we may earn a commission when you click some links. Bought places stand at the number bought; this page and our disclosure say so. Paying vendors may get a fuller, more detailed review from our editors, and that review can change their score. How we rank.
Last updated · How we research and update