
Forsta Visualizations
Forsta Visualizations: A survey-focused reporting platform with live data, statistical analysis, and export tools. Ranked #27 of 42 in Infographic Software by our editors (6.5/10); pricing: Pricing on request; best for enterprise survey visualization programs.
At a glance
- Editor score6.5 / 10
- PricingPricing on request
- Best forEnterprise survey visualization programs
- Interactive publishingYes
- Facts checked19 Sep 2026
Where it wins
- Combines interactive dashboards with dynamic filtering and live data refreshes.
- Includes weighting and significance testing alongside visualization tools.
- Exports reports to PowerPoint, Excel, and PDF, with APIs for integration.
Where it doesn't
- Pricing is negotiated through sales rather than published as plans.
- Its survey and experience-data focus may not suit general-purpose infographic work.
- AI summaries and reporting may be unnecessary for teams seeking basic charts.
Our verdict on Forsta Visualizations
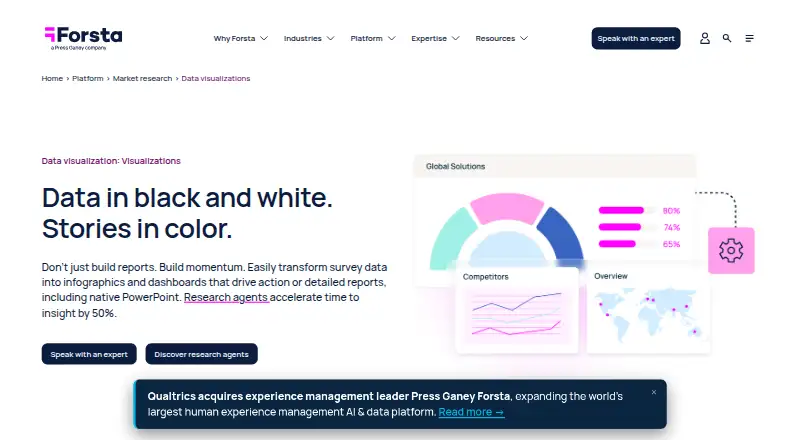
Forsta Visualizations brings survey data, external datasets, dashboards, and reporting into a web-based workspace for market researchers and teams handling customer or employee experience data. Its combination of visual design, statistical analysis, and stakeholder sharing is aimed at programs that need more than static infographics. Teams looking for flexible survey reporting can shape dashboards and reports; those who need only occasional standalone graphics may find the research-oriented scope a poor fit.
The feature set reaches from drag-and-drop free-form design to interactive dashboards with dynamic filtering, live data connections, and automatic refreshes. Imported external datasets and third-party data broaden the inputs, while weighting and significance testing support analysis beyond chart presentation. Branding controls cover colors, fonts, logos, and reusable templates. Reporting can be exported to PowerPoint, Excel, and PDF, and visualization APIs provide another route to incorporate outputs into systems. AI-assisted summaries and report generation add a synthesis layer, though the product’s strongest case remains connected survey visualization and reporting rather than general-purpose design.
Forsta lists integrations with Decipher, Forsta Plus, survey systems, and third-party systems, with collaboration and stakeholder sharing for teams. That ecosystem emphasis makes the product more suitable for organizations coordinating recurring research reports than for individuals seeking a quick infographic editor. Pricing is handled through sales orders and negotiated price levels, so buyers should expect a sales-led purchasing process rather than selecting from published plan tiers. Choose it when survey reporting, live data, statistical tools, and export workflows belong together; consider a narrower visualization tool if those research and team capabilities are not needed.
Your product? Our editors can test Forsta Visualizations in depth and publish a review, labelled as paid · from $149/mo →
Forsta Visualizations pricing
Forsta Visualizations fact sheet
| Free plan | Not verified |
|---|---|
| Paid from | Not verified |
| Data import | Yes |
| Interactive publishing | Yes |
| Brand kit | Yes |
| Team collaboration | Yes |
| Publishing mode | Both |
| Project limit | Not verified |
| Deployment | Cloud |
| Platforms | Web |
| Integrations | 4 integrations: Decipher, Forsta Plus, survey systems, third-party systems |
| Pricing | Pricing on request |
| Website | forsta.com |
| Facts checked | 19 Sep 2026 |
Forsta Visualizations integrations
Forsta Visualizations lists 4 integrations on its own site.
- Decipher
- Forsta Plus
- survey systems
- third-party systems
Alternatives to Forsta Visualizations
- InfogramA versatile visual-data tool, with deeper publishing and team features on paid plans.9.4
- PiktochartA versatile visual-design tool with a free plan and paid options for teams and branding.9.2
- VismeA broad visual-content toolkit, with plan tiers that determine export options and team controls.9.0



See all Forsta Visualizations alternatives →
Also Ranked In
Forsta Visualizations is ranked in 6 of our directories.
Used Forsta Visualizations? Be the first to review it
The editor score above is our own research. What this page doesn't have yet is a reader's view — what you used Forsta Visualizations for, what worked and what didn't. No stars are seeded and no review is paid for; an editor reads every one before it appears.
Write a reviewTwo minutes · verified accounts only · read by an editor before it appears
Featured on iTechGuides

Forsta Visualizations is listed in our Infographic Software directory. Add the badge to your site — it links back to this page.
<a href="https://www.itechguides.com/products/forsta-visualizations/"><img src="https://www.itechguides.com/best/badge/forsta-visualizations.svg" alt="Featured on iTechGuides" width="230" height="46"></a>
Reviewed by iTechGuides Editors · Editorial team · Updated Oct 2026
Advertiser disclosure: iTechGuides is reader-supported. Vendors can pay for top positions in our rankings and for a place on other products' pages, and we may earn a commission when you click some links. Bought places stand at the number bought; this page and our disclosure say so. Paying vendors may get a fuller, more detailed review from our editors, and that review can change their score. How we rank.
Last updated · How we research and update