
What’s actually slowing this PC down?
Pick the symptom - the matching free tool is one click away.
Use the monitoring tool that matches your GPU vendor and kernel driver: NVIDIA users should start with nvidia-smi, AMD users should follow the current AMD SMI/ROCm guidance, and Intel users can try intel_gpu_top. These utilities expose different metrics and may require specific permissions. For driver faults, combine them with kernel logs and vendor-specific debug interfaces rather than treating one command as universal.
Identify the GPU and active driver first
Before running a monitor, determine which device and kernel driver are actually in use:
lspci -k | grep -EA3 'VGA|3D|Display'Record the GPU model, kernel driver, distribution, and monitoring-tool version. NVIDIA, AMD and Intel commands are not interchangeable, and a metric missing from one system may simply be unsupported by that device or driver.
NVIDIA: nvidia-smi, dmon and pmon
Take a one-time snapshot
nvidia-smi displays management and monitoring information for supported NVIDIA devices, including utilization, memory, temperature, power and processes when those fields are available. NVIDIA documents the interface at its NVIDIA System Management Interface reference.
#1 Best Overall
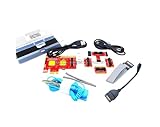
- ATTN : Please DO study the listing page the "Product Guides and Documents" section, the "Instructions for Use (IFU) (PDF)" guide for all manual links at the end of the PDF, to use this kit correctly and easily. 【The item PACKING】 includes the paper printout with the same Complete Instruction Folder with PDFs and APP. 【Only use the tested APP in the folder】 【BOTH 64bit for Newer Androids and 32bit Manufacturer APP】 are available, passed the Android security scan checks and Google Play pending. MUST use the Android APP to display results on the screen, NO Traditional DIGITAL Display to show the POST codes, Great Ease to save hassles of diagnostic codes lookup one by one manually.
- Easy To Use Unique USB Diagnosis with Videos and PDF Guides. 【MUST study the Guides Before Use】 New latest smartphone technology in using the USB ports ( Standard USB / micro USB / Type C ) to diagnose the computers. 【NOT just getting the electric power but RUNNING the Diagnosis Data through USB ports】. A very powerful Essential Nice Handy computer repair tool kit for quick help on diagnosing Desktop PC, Server, Laptop, All-in-one PC, Android Smartphone / Tablet, customized built miniPC and Mac machines ... etc. A great motherboard tester diagnostic kit that provides the most accuracy and effectiveness in making the computer troubleshooting and repairs much easier.
- USB Diagnosis Unique Feature - Save hassles of taking the dusty PCs or laptops apart. Follow the English PDF user guides to power on and let the Android APP to work with this new test kit to auto scan the motherboard for faulty components quickly. When testing different PCs together, make sure follow the listing User Guide(PDF) to see 【Latest Updates with PRECAUTIONs and Extra Tech Tip】 to UNPLUG the USB cable between each test and restart to clear the last cached working motherboard diagnosis data. The ONBOARD USB cable is needed to plug to the Android charger, the other dedicate USB cable connects to motherboard USB port. Connect this 2 USB cable wrongly causes the unstable connectivity.
- All-in-one Multiports support - Different complete bus connector adapter parts included. Made of quality PCB, transistors and capacitor components. Direct pinpointing the faulty motherboard components to greatly reduce the costs yet increase the effectiveness in the computer diagnostic repairs. Videos and the PDFs instructions please see the listing "Videos" section and the "Product guides and documents" section for more details.
- Tested and brought to you by 29 years IT Professionals This kit works with all machines with USB ports including New Old Desktop PC and Laptop Computers, IBM compatible, Mac machines (using USB), Android devices Smartphones and Tablet PCs. Comes with Step by Step Easy Guides, videos instructions, PDF pictorial manuals with Easy Flowcharts and Latest Updates with Precautions. Great for PC Technicians, Computer Owners, Computer Class Student Learners and PC DIY Lovers, Hardware Traders, professionals and novices . Nice Essential must have to add to our computer tool boxes.
nvidia-smiFor scripts, query specific fields instead of parsing the default screen:
nvidia-smi --query-gpu=name,driver_version,temperature.gpu,utilization.gpu,memory.used,memory.total --format=csvNVSMI can emit standard output, CSV or XML. NVIDIA warns that output is not guaranteed to remain backwards compatible, so pin and test the tool version when automation depends on field names or layout.
Watch device-wide activity continuously
nvidia-smi dmondmon samples device-level metrics repeatedly. Select a sampling interval with the command’s interval options and consult nvidia-smi dmon --help for metrics supported by your driver and GPU. Unsupported values can appear as dashes, which means “not supported” rather than zero.
See which processes use the GPU
nvidia-smi pmonpmon reports GPU process activity. Use it alongside dmon: the first tells you which processes are consuming resources, while the second shows aggregate device behavior. Visibility depends on driver capabilities, permissions and the device mode.
The Tool Desk
Outbyte Driver Updater FREEFix the driver behind crashes, sound loss and screen glitchesFind Drivers →Outbyte PC Repair FREEClear out junk files and repair common Windows errorsFree Scan →Rank #2

- PCI and ISA 4 digit PCI analyzer:standard PCI and ISA interface, easy access to desktop PC.
- Standard PCI and ISA interfaces for easy access to desktop PCS.4 digit display,the first 2 digits indicate the current error code,and the last 2 digits indicate the previous error code.
- After power on self test,the card will quickly display the error code,the provided error code table allows you to easily understand the error details.
- Compatible with all mainstream motherboards.Support code search function.
- Support motherboard bus speed test.
Save comparable NVIDIA samples
When redirecting output, note the model, driver version, sampling interval, workload and format:
nvidia-smi dmon -o DT -f gpu-monitor.logCheck the installed command’s help because available options and fields vary across releases.
AMD: ROCm SMI today, AMD SMI going forward
AMD’s ROCm SMI documentation describes a Linux user-space interface for monitoring and controlling GPU applications. AMD identifies AMD SMI as its successor and recommends transitioning to it over time. For a new deployment, consult the current documentation rather than assuming ROCm SMI is the long-term interface: ROCm System Management Interface documentation.
The exact command and metric set depend on the installed ROCm/AMD SMI package, GPU generation and driver stack. Verify the utility’s own help and package documentation before putting a command into a script. A blank or unavailable field is not proof that the GPU is idle.
Rank #3
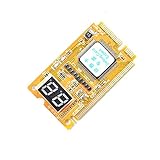
- 3 in 1 tester.
- For PCI, PCI-E, and LPC.
- Diagnostic post-test card.
- Diagnostic post-test card.
- Easy to use.
Intel: intel_gpu_top and intel-gpu-tools
Install and run the monitor on Ubuntu
Intel’s support guidance recommends intel_gpu_top, supplied by the intel-gpu-tools package, for observing Intel graphics:
sudo apt update
sudo apt install intel-gpu-tools
sudo intel_gpu_top
Intel cautions that intel-gpu-tools is intended for DRM driver development and testing and that intel_gpu_top “may or may not suit your needs.” Treat it as a useful diagnostic utility, not a promise of identical support on every Intel platform. See Intel’s guidance (reviewed 2025-08-25) at Intel’s GPU performance-monitoring article.
Select a device and export data
The intel_gpu_top manual documents text, CSV and JSON output, device selection and platform-dependent metrics. Check the installed version’s options:
intel_gpu_top --help
intel_gpu_top -o -
Use the output mode documented by your version when collecting data for later analysis. Not every metric exists on every platform.
Do these 3 things before closing this tab:
1Scan for outdated or missing drivers - takes under a minute2Repair Windows errors before they cause bigger problems3Fix the driver behind crashes, sound loss and screen glitchesRank #4

- Multi Slot Board Layout: AGP and PCIe connection formats let technicians review different graphics card hookup paths on a single board during computer repair diagnostics and service prep
- Repair Workflow: Use this graphics card diagnostic board as a workstation troubleshooting aid when checking dark screen, blurry output, or erratic display behavior before deeper repair work begins
- Response Light Observation: Dense response light areas give a clearer reading of board activity during troubleshooting, helping users compare fault behavior without relying on guesswork alone
- Compact Workstation Reference: Approx 13cm / 5.12inch x 11cm / 4.33inch x 2cm / 0.79inch size lets the board fit tool areas and workstations while staying focused on repair use
- Powered Workstation Setup: A visible power connector and button powered diagnostic use, so repair stations can prepare the board for practical graphics card troubleshooting workflows
Resolve performance-counter permission errors
Non-root access to Intel performance counters is controlled by the kernel’s perf_event_paranoid policy. If the command reports a permissions failure, either run it with the required privilege or ask the system administrator to review that policy; do not weaken it blindly on a multi-user machine. The command reference is available at the Debian intel_gpu_top(1) manual.
Kernel logs and low-level AMDGPU diagnostics
Check for driver and GPU errors
Start with the kernel log when the symptom is a hang, reset, fault or failed device initialization:
dmesg -T | grep -iE 'gpu|drm|amdgpu|nvidia|i915|error|fault|reset'On systems using the journal, this is often more useful:
journalctl -k -b | grep -iE 'gpu|drm|amdgpu|nvidia|i915|error|fault|reset'These filters are broad; inspect surrounding lines and the boot in which the failure occurred.
Quick wins for a faster PC:
Fix the driver behind crashes, sound loss and screen glitchesFind Drivers →Repair Windows errors before they cause bigger problemsFix Now →Scan for outdated or missing drivers - takes under a minuteDriver Scan →Best Value

- Serial Comm Protocol: This laptop motherboard analyzer diagnostic card adds a serial communication protocol—including DEBUG for UART1 and —expanding its range of applications. Whether you’re troubleshooting motherboard issues or conducting in-depth diagnostics, this protocol support lets the card interface effectively with relevant systems. It enhances the card’s functionality, making it a versatile tool for handling various diagnostic tasks in repair or maintenance work.
- Strong Compatibility: Designed for broad use, this laptop motherboard analyzer diagnostic card supports PCI E, mini PCI E, and LPC interfaces, plus all PCI slots. Its strong compatibility means it works with a wide range of laptop motherboards, eliminating the need for multiple specialized cards. Whether you’re working on older or newer motherboard , this card fits seamlessly, boosting efficiency in repair and diagnostic processes.
- Good Performance: This laptop motherboard analyzer diagnostic card delivers reliable performance with a high recognition rate, plus it supports automatic recognition of power modules. Its high efficiency means it streamlines diagnostic work—you spend less time on manual setup and more on resolving issues. Whether you’re a professional technician or handling routine maintenance, its strong performance ensures accurate, fast results every time.
- LED Indicator: Equipped with multi-channel detection and multiple LED indicators, this laptop motherboard analyzer diagnostic card clearly displays the status of key components—power supply, motherboard, , memory, video card, and hard drive. The LED lights let you quickly identify issues without complex setup, speeding up the diagnostic process. It simplifies troubleshooting by providing real-time, easy-to-read status updates for each component.
- Included Tools: This laptop motherboard analyzer diagnostic card kit comes complete with the diagnostic card, a laptop adapter card, connection cables, and ribbon cables. Everything you need for setup is included, making connection and operation easy—no extra tools to purchase. The kit ensures convenience and practicality, letting you start diagnosing laptop motherboards right out of the box, saving time and effort.
AMDGPU debugfs
Linux kernel documentation describes AMDGPU debugfs files, generally below /sys/kernel/debug/dri/<num>, as driver-debugging interfaces. They can expose facilities for examining GPU state, benchmarking or recovery, but the available files depend on the kernel, device and topology. Read the AMDGPU DebugFS documentation and the kernel GPU Debugging guide for the specific fault.
Do not write to reset, recovery or other debugfs controls casually. A shared GPU, display session or compute workload can be disrupted, and the behavior is not a cross-vendor standard.
Independent reader supportYour contribution helps us test, update, and keep practical guides available for everyone.Choose the right command for the question
| Tool | Vendor/stack | Best use | Output and limits |
|---|---|---|---|
nvidia-smi |
NVIDIA supported devices | Snapshot, field queries and management information | stdout, CSV and XML; output compatibility is not guaranteed |
nvidia-smi dmon |
NVIDIA | Repeated device-level sampling | Metrics vary by device and driver; unsupported values may be “-” |
nvidia-smi pmon |
NVIDIA | GPU process activity | Visibility depends on mode, driver and permissions |
| ROCm SMI / AMD SMI | AMD ROCm stack | Monitoring and control of AMD GPU applications | AMD SMI is the successor; consult current documentation for new workflows |
intel_gpu_top |
Intel DRM devices | Interactive Intel GPU activity monitoring | Text, CSV and JSON; platform metrics vary; performance-counter policy may restrict access |
| AMDGPU debugfs | Linux AMDGPU driver | Low-level fault and driver diagnosis | Driver-specific files under debugfs; not routine cross-vendor monitoring |
A repeatable troubleshooting workflow
- Identify the stack. Confirm the GPU, active kernel driver and tool version.
- Capture a baseline. Run the vendor snapshot command before reproducing the problem.
- Observe during the workload. Use NVIDIA
dmon/pmon, the applicable AMD SMI utility or Intelintel_gpu_top. - Interpret missing fields correctly. A dash, blank or absent counter can indicate unsupported hardware, firmware, driver or permissions—not zero utilization.
- Correlate with kernel events. Review
dmesgorjournalctl -kfor resets, hangs, faults and initialization errors. - Escalate carefully. For AMDGPU faults, consult the kernel debugfs and debugging documentation; avoid recovery writes unless you understand their device-specific effect.
- Preserve context. Save the GPU model, driver and tool versions, workload, sampling interval, timestamp and output format with every capture.
Common failure modes
“Command not found”
Install the vendor’s package or SDK, then verify that the executable is on PATH. An installed open-source driver does not automatically provide every vendor monitoring utility.
No process appears
Check that the workload is using the device you queried, that the process is still running, and that driver permissions allow process visibility. A short-lived job may finish between samples.
Utilization stays at zero
Confirm the workload is GPU-bound and that you are reading the correct engine or device. Also check for unsupported counters, which NVIDIA and Intel document as platform-dependent.
Permission denied
Use the least privilege required. Intel performance counters are governed by perf_event_paranoid; other vendors can impose their own device-node or container policies.
Metrics changed after an upgrade
Recheck the command reference and update parsers. NVIDIA explicitly does not guarantee backwards-compatible output, and metric availability changes with hardware and driver versions.
Quick Recap
Product prices and availability are accurate as of the date/time indicated and are subject to change. Any price and availability information displayed on Amazon at the time of purchase will apply.

