
The Tool Desk
Outbyte PC Repair FREERepair Windows errors before they cause bigger problemsFix Now →Outbyte Driver Updater FREEFix the driver behind crashes, sound loss and screen glitchesFind Drivers →iTechGuides is reader-supported. When you buy through links on our site, we may earn an affiliate commission. As an Amazon Associate I earn from qualifying purchases. Learn more
Estimate an AI data center in separate steps: define whether capacity means IT load or utility service, model annual IT electricity from the equipment and its operating profile, apply an explicit PUE or a facility model, and build a capital budget from benchmarks that match the location, project type, date and scope. Keep construction, active IT equipment, land, utility work and electricity bills separate; without site, design, tariff and procurement details, the result is a planning range—not a project quote.
Define what you are estimating before using a cost per MW
A megawatt figure is not enough to compare projects. First write down the basis of estimate so every energy and cost figure refers to the same project boundary.
- Location and delivery year: country or market and the target date for delivery. Labor, equipment supply, tariffs and cost benchmarks vary by place and time.
- Capacity basis: target IT load in MW, or utility service capacity in MW. State which one you mean; they are not interchangeable.
- Project type and scope: single-tenant, colocation or enterprise; and whether the estimate covers shell/core, mechanical and electrical systems, utility works, land, active IT equipment, professional services or operating costs.
- Compute plan: quantities and expected operating power for servers and accelerators, storage and networking, plus utilization and idle-power assumptions.
- Facility design: air or liquid cooling, reliability and redundancy requirements, and the assumptions used for power distribution and cooling.
Record uncertain inputs as ranges rather than hiding them inside one number. A conceptual estimate should show what is included, excluded and unknown.
Estimate annual electricity from the equipment up
Start with an equipment schedule. For each category, estimate quantity and power draw under the expected operating profile. The model should account for both active and idle periods; multiplying the rated or peak load by all hours in a year can materially misstate consumption.
#1 Best Overall

- Ultra-Lightweight: At only 7.5 lbs, the Explorer 300 delivers a robust 292Wh capacity while remaining 17% lighter than the industry average. The sleek, integrated handle makes it effortless to carry on long hikes or pack with your camping gear, providing reliable off-grid power without adding bulk to your load.
- Versatile Power for 6 Devices: Equipped with 2 AC outlets, a 100W USB-C PD port, 2 USB-A ports, and a 120W car port. With a 300W rated output (600W peak surge), it easily handles laptops, drones, and cameras, while also serving as a dependable cpap battery for camping or a robust solar powered generator when paired with panels.
- Built to Last: Upgraded with premium LiFePO4 chemistry, this portable generator delivers over 4,000 charge cycles before reaching 70% capacity. This ensures more than 11 years of reliable service life, making it a sustainable and durable energy partner for a decade of exploration.
- Fast Solar Charging: Perfect for off-grid use, this solar powered generator pairs seamlessly with Jackery panels. Reach 80% capacity in approximately 2.8 hours with a 100W solar panel, or maintain your gear with a portable 40W panel (80% in 7.5 hours), making it an essential part of your hunting essentials.
- WHAT YOU GET: 1* Jackery Explorer 300 Portable Power Station, 1*AC adapter, 1* car charger cable, 1* user guide (𝐒𝐨𝐥𝐚𝐫 𝐏𝐚𝐧𝐞𝐥 𝐍𝐨𝐭 𝐈𝐧𝐜𝐥𝐮𝐝𝐞𝐝.)
Calculate IT energy
For a first-pass calculation, determine average IT power over the year, then multiply by operating hours:
Annual IT energy (kWh) = average IT load (kW) × operating hours
For a full non-leap year, 8,760 hours is the arithmetic basis. If utilization or power changes through the year, model separate operating periods and add their energy rather than assuming one constant load. A simple utilization model may interpolate between idle and loaded power, but use equipment-specific assumptions where available.
Rank #2

- 【SLIM & POCKETABLE】This portable power bank is about the size of a smartphone (6.5×3.3×4 inches) and weighs only 2.54 pounds. It features an ergonomic soft handle for easy portability. It easily fits into a backpack for convenient portability. Pro Tip: Fully charge and discharge the battery twice initially for the best experience.(Solar panel and cable not included)
- 【DUAL INPUT/OUTPUT (AC + DC)】The portable power station comes with a 89.6Wh capacity LiFePO4 battery pack(not NCM) and 100W, features 7 output ports, including 2 AC sockets (100W),2 USB-C port (45W/15W), 2 USB-A port (18W/15W), and DC5521 ports (60W). The LED display can clearly show the working status and remaining power.(Please peel off the protective film on the screen after unboxing)
- 【Ultra Fast Charging】With unique fast charging technology,the portable generator can be charged from 0-80% just in 1.5hrs. The solar power bank power station has Four methods to charging: AC wall socket fast charging, USB-C DC two-way PD fast charging(AC and DC can be charged at the same time) ,car charging and solar panel charging.Fast charging solar power bank portable charger suitable for for emergency home backyard outdoor power outages off-grid camping essentials
- 【ULTRA-QUIET & EMERGENCY-READY POWER STATION】Experience silent, fanless operation perfect for sleeping, working, or camping, while the built-in 4-level LED flashlight (with steady/SOS modes) ensures emergency readiness. Its accidental-touch-proof design requires a long-press to activate, ideal for charging devices during outages or outdoor adventures without noise disruption.(Only suitable for powering devices within 100W).
- 【Long-Lasting & Safe LiFePO4 Battery】: 3500+ life cycles (far exceeding standard batteries). Durable LiFePO4 batteries last 3x longer than standard lithium batteries! Advanced BMS provides 12 safety protections, monitoring voltage, current & temperature. Powers your smartphone, laptop, mini-fridge, camera, and drone simultaneously.
Convert IT energy to facility energy
Power usage effectiveness (PUE) is total facility energy divided by IT-equipment energy. Therefore:
Estimated facility energy = IT energy × assumed PUE
For example, an explicitly hypothetical facility averaging 10 MW of IT load for a full non-leap year would use 87,600 MWh of IT energy. At an assumed PUE of 1.2, the corresponding facility-energy estimate would be 105,120 MWh. These are arithmetic illustrations, not equipment or facility forecasts.
Rank #3
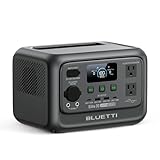
- [288Wh On-the-Go Power] - Only 9.4 lbs lightweight, carry it anywhere during storms! 288Wh capacity meets daily & outdoor needs—camping, road trips, beach visits, or home emergencies. Extend your smart green energy life to every corner of your ideal lifestyle with this compact entry-level power station.
- [600W Continuous & 1500W Surge Power] - Get a full 600W output—twice as much as others. When you need serious power, activate Power Lifting Mode for 1500W power (vs. the typical 600W). It runs everything from essential camping lights, speakers, and car fridges to critical devices like laptops and CPAP machines and even a small kettle or toaster—ideal for stormy days at home or outdoor trips.
- [50% Lower Power Consumption] - Upgraded UltraCell tech & smart cooling system cut power consumption by 50%. Enhances overall energy efficiency, extends device runtime. Excellent durability & environmental adaptability for extreme outdoor climates and long-term operation.(Standby power only 4.5W, DC 5W, AC 8W)
- [8 Charging Modes & 380W Fast Wall Charge] - Supports AC wall charge (380W/200W adjustable), solar, car charging, etc. 0-80% in 45 mins, 0-100% in 70 mins (battery-safe). Match PV60L solar panel for on-the-go recharging. Flexible charging solutions for city, wilderness, daily or emergency scenarios.
- [Reliable UPS] - Never lose data or stop your devices during winter storms/blackouts! 10ms ultra-fast UPS switch protects CPAP, laptops, routers—critical for home emergencies when power cuts suddenly.
PUE represents facility overhead relative to IT energy; it is not a percentage saved and does not measure how efficiently the AI workload performs its computing. A detailed design estimate should model power conversion and cooling for the facility configuration and climate rather than treating PUE as a guaranteed project result.
Use PUE benchmarks as context, not promises
| Published figure | What it describes | How to use it |
|---|---|---|
| 1.145 in 2024; modeled 1.136 in 2030 | Lawrence Berkeley National Laboratory’s 2026-published national estimates for facilities serving AI equipment. PUE is facility energy, including cooling and distribution, divided by IT-equipment energy. | Use as national modeling context, not a prediction for a particular new facility. |
| 1.56 in the 2024 survey (n=526) | Uptime Institute’s industry-average survey result. Respondents were asked about their largest data center. | Use as a different population and survey measure, not as a directly interchangeable alternative to Berkeley Lab’s AI-facility estimate. |
Uptime Institute notes that site climate and business objectives vary, and that PUE does not capture water use, supply-temperature trade-offs or IT-system energy performance. A low PUE alone does not establish that a facility or its computing is efficient overall.
Build a capital estimate with explicit scope
Choose a benchmark that matches the market, project size and type, delivery date and cooling configuration as closely as possible. Then separate the budget into lines rather than multiplying one headline cost per MW and calling the result all-in.
Rank #4

- Powerful yet Compact: Boasting a 1,500W AC output and a 3,000W surge peak, the Solar Generator 1000 V2 can power multiple appliances, including AC units, fridges, and electric pots. With a 1,070Wh capacity and a lightweight build of only 23.8 lbs, along with a foldable handle, it makes an excellent companion for outdoor camping, road trips, or emergencies.
- One Hour Fast Charging: Charge your Explorer 1000 v2 Portable Power Station from 0% to 100% battery level in just one hour with emergency charging activated via the Jackery App. It defaults to 1.7 hours for a full charge to optimize battery health. Engineered with advanced ChargeShield 2.0 technology, this power station charges safer, faster, and smarter.
- 10 Year Lifespan: The Explorer 1000 v2 portable power station is equipped with a durable LFP battery, maintaining over 70% of its original capacity even after 4,000 charge cycles, offering longevity exceeding 10 years.
- Tailored for Versatility: Featuring two USB-C ports, one USB-A port, one DC car port, and three pure sine wave AC ports, along with LED lights, the Solar Generator 1000 V2 is capable of charging multiple devices simultaneously, meeting power needs in various scenarios. PD 100W fast USB-C charging ensures a rapid charging speed, even without power adapters.
- Smart App Control: Effortlessly switch between different charging modes with Jackery’s App—including one hour emergency charging from 0 to 100%, 30 dB quiet overnight charging mode, and energy efficiency mode. Maximize the freedom to adjust the power station to meet your needs.
- Shell/core and architectural work
- Mechanical and electrical fit-out and equipment
- Contractor preliminaries, margin and contingency
- Client-direct and site costs, including abnormal groundworks where relevant
- Utility works and interconnection
- Land
- Professional services
- Active IT and technology fit-out
For each line, mark whether the benchmark includes it, excludes it or leaves it unknown. Do not add excluded costs unless you have a separate estimate for them.
Know what each published construction benchmark covers
| Source and date | Published benchmark | Scope and qualification |
|---|---|---|
| Turner & Townsend, 2025 methodology | No single per-MW amount is stated here. | Modeled baseline: air-cooled, build-to-suit hyperscale facility with 30–50 MW of IT load. Cost headings include shell/core, architectural fit-out, mechanical/electrical fit-out and equipment, contractor preliminaries, margin and contingency. Excludes client-direct costs, land, utility works, abnormal groundworks, site works, active IT equipment and professional services. |
| JLL Research, 2026 outlook | Global average shell-and-core benchmark of $10.7 million per MW in 2025; forecast of $11.3 million per MW in 2026. | Excludes land and active IT equipment. JLL’s geographic examples vary, so select the relevant market and confirm capacity and cooling assumptions before applying the figure. |
| JLL Research, 2026 outlook | AI technology fit-out may cost as much as $25 million per MW. | A separate possible tenant technology fit-out cost, not a general addition that applies to every project and not shell/core construction. |
As a scale illustration only, multiplying JLL’s global 2025 shell-and-core average by 10 MW gives $107 million; using its 2026 forecast gives $113 million. This arithmetic does not turn either benchmark into an estimate for a specific 10 MW facility: the figures exclude land and active IT, and market, capacity and design assumptions must still match.
Free tools Windows power users keep installed
One-click scans. No signup required.
Account for cooling without treating a premium as universal
Turner & Townsend reports that liquid-cooled facilities average a 7–10% premium over similar air-cooled benchmarks in its 2025 methodology. Its baseline is a 30–50 MW air-cooled hyperscale build-to-suit model. Treat the premium as a benchmark adjustment to check against the actual design and scope, not as a multiplier for every liquid-cooled project.
Best Value
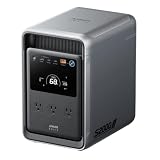
- 𝐔𝐩 𝐭𝐨 𝟑𝟓-𝐇𝐨𝐮𝐫 𝐅𝐫𝐢𝐝𝐠𝐞 𝐁𝐚𝐜𝐤𝐮𝐩: With 6W idle power draw and 10% higher efficiency, this power station runs 20% longer than other 2kWh systems, keeping your fridge powered for 35 hours.
- 𝟏𝟎,𝟎𝟎𝟎-𝐂𝐲𝐜𝐥𝐞 𝐋𝐅𝐏 𝐁𝐚𝐭𝐭𝐞𝐫𝐲: Powered by 314Ah LFP cells, S2000 has a 15-year lifespan, equivalent to 10,000 charge cycles.
- 𝐒𝐦𝐚𝐥𝐥𝐞𝐬𝐭 𝐚𝐧𝐝 𝐋𝐢𝐠𝐡𝐭𝐞𝐬𝐭 𝟐𝐤𝐖𝐡 𝐏𝐨𝐰𝐞𝐫 𝐒𝐭𝐚𝐭𝐢𝐨𝐧: 30% smaller and 25% lighter than the industry average, this power station measures just 8.2 × 11.1 × 12.7 in and weighs only 35.7 lbs.
- 𝐏𝐨𝐰𝐞𝐫𝐬 𝟗𝟗% 𝐨𝐟 𝐇𝐨𝐦𝐞 𝐄𝐬𝐬𝐞𝐧𝐭𝐢𝐚𝐥𝐬: 1,500W continuous output and 3,000W peak output keep nearly every essential appliance running. Actual runtime will vary depending on your refrigerator model, usage habits, and ambient temperature.
- 𝟔 𝐖𝐚𝐲𝐬 𝐭𝐨 𝐑𝐞𝐜𝐡𝐚𝐫𝐠𝐞: Supports up to 400W solar input. Power up via AC + solar, a wall outlet, a generator, solar panels, an alternator charger, or a car outlet—anytime, anywhere.
Estimate the electricity bill separately
After estimating facility energy in kWh, multiply it by an applicable electricity-price assumption. State whether the rate is energy-only or an all-in average. Add demand charges, taxes, procurement or contract charges and other tariff components where they apply.
No site-specific tariff is established by the benchmarks discussed here, so they cannot determine a project’s electricity bill. Show low, base and high cases for both utilization and price when either is uncertain; label the assumptions and calculate each case from the same facility-energy method. Keep recurring electricity expense distinct from capital construction and equipment costs.
Use national forecasts to understand uncertainty, not price a facility
Lawrence Berkeley National Laboratory’s 2026-published U.S. data-center energy update gives a 2030 reference-case estimate of 649 TWh. Its sensitivity cases are 578, 664, 590 and 782 TWh, reflecting alternative assumptions about equipment installations, specialized chip shipments, AI-chip lifetime, and AI-server idle-power and utilization. A compounded uncertainty envelope is 521–843 TWh in 2030.
What’s actually slowing this PC down?
Pick the symptom - the matching free tool is one click away.
These are model-derived national scenarios, not a count of every meter or an estimate for an individual AI data center. Their spread shows why equipment shipments, chip lifetime, utilization and idle energy should be visible in a project model rather than concealed behind one point estimate.
For historical context, a 2024 U.S. Department of Energy and Berkeley Lab report estimated 176 TWh of U.S. data-center electricity in 2023, about 4.4% of U.S. electricity, and projected 325–580 TWh for 2028. The 2026-published update is the newer national forecast; the earlier figures are useful context, not a substitute for a project equipment model.
Turn a first-pass range into a project estimate
- Fix the boundary: specify market, delivery year, IT MW versus utility MW, project type, cooling, redundancy and included cost categories.
- Build the equipment schedule: estimate quantities and operating power for accelerators and servers, storage and networking, including idle operation and utilization over time.
- Calculate annual IT energy: use time-weighted average IT load and operating hours, with separate periods where load changes.
- Model facility overhead: apply a clearly labeled PUE assumption for a first pass, or replace it with a cooling and power-distribution model suited to the site.
- Scope capital line by line: select a market- and project-matched benchmark, identify its exclusions, and estimate excluded items separately before totaling.
- Price operations: apply low/base/high tariff and utilization assumptions to facility kWh, including demand and other charges where relevant.
- Report uncertainty: show the assumptions driving the range and leave unresolved costs or inputs visibly unknown rather than implying precision.
A credible project estimate requires, at minimum, the location, capacity basis, design and redundancy, equipment schedule, delivery date, utility and interconnection scope, tariff and procurement assumptions.
Quick Recap
Product prices and availability are accurate as of the date/time indicated and are subject to change. Any price and availability information displayed on Amazon at the time of purchase will apply.

