
The Tool Desk
Outbyte PC Repair FREERepair Windows errors before they cause bigger problemsFix Now →Outbyte Driver Updater FREEFix the driver behind crashes, sound loss and screen glitchesFind Drivers →iTechGuides is reader-supported. When you buy through links on our site, we may earn an affiliate commission. As an Amazon Associate I earn from qualifying purchases. Learn more
To create a music visualization, first decide whether you need a finished video or a visual that reacts live. For an edited, composed deliverable, Adobe After Effects has Audio Spectrum and Audio Waveform effects plus a documented render workflow. For node-based audio analysis and live interaction, TouchDesigner’s Audio Spectrum CHOP analyzes input channels. These are different production approaches, not a universal ranking of the tools.
Choose the kind of visual you are making
A spectrum and a waveform communicate different things. Adobe describes Audio Spectrum as showing magnitude across a selected frequency range; Audio Waveform represents audio samples. A spectrum can make frequency movement visible, while a waveform traces the changing signal. Pick the one that supports what you want viewers to notice.
Before opening a tool, listen to the track and choose a few musical features to emphasize: overall level, transient hits, low- or high-frequency movement, a repeated motif, or a transition. Start with a restrained mapping—for example, one element responding to overall level and another to a selected frequency range—then preview and refine it. These are creative starting points, not required technical standards.
Outdated Drivers Are Slowing You Down
One free scan finds every outdated or missing driver and matches the right update for your exact hardware.Free scan · exact hardware matchPC Slower Than It Used to Be?
A free scan shows the junk files, broken settings and background clutter dragging Windows down - then fixes them in one click.Free scan · Windows 10 & 11Choose a workflow: rendered video or live interaction
| Decision | After Effects | TouchDesigner |
|---|---|---|
| Documented audio analysis | Audio Spectrum and Audio Waveform effects; Spectrum has configurable frequency range, path, bands, and display options. Adobe documentation | Audio Spectrum CHOP calculates and displays the frequency spectrum of input channels. TouchDesigner documentation |
| Practical fit | A composed, edited video with an explicit render/export step; this fit follows from Adobe’s effect and Render Queue documentation. | A node-based exploration or live visual when interactive control matters; this fit follows from the documented node and spectrum functionality. |
| Questions to ask | Do you want to compose a finished video, and do you already work in After Effects? | Do you want a live interactive visual, and are you comfortable with node-based tools? |
| Delivery information documented here | Adobe documents Render Queue format, codec, duration, and destination controls. | Export workflow details are not established by the cited documentation here. |
The sources do not establish a current licensing or price comparison, or a performance winner. Choose according to the output you need, the control you want, and the software workflow you already know.
#1 Best Overall
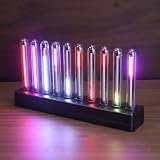
- SOUND-REACTIVE DISPLAY: LED music visualizer responds in real time to surrounding audio, creating a dynamic light show synced to your music.
- SPECTRUM ANALYZER: Captures and displays sound frequencies across multiple LED channels for a vivid, accurate visual representation of audio.
- VERSATILE DECORATION: Perfect ambient lighting accent for gaming rooms, bedrooms, home studios, or car interiors.
- SENSING SOUND MODULATION: Built-in sound pickup sensor detects audio and modulates LED colors and patterns automatically without manual input.
- EASY AMBIENT LIGHTING: Plug-and-play setup lets you instantly enhance any space with colorful, music-driven LED light effects.
Build a first pass in After Effects
-
Place the audio in a composition and apply Audio Spectrum or Audio Waveform to a video layer.
-
For Audio Spectrum, select the input audio layer and set the display path or start and end points. A straight line is one option; a mask path can shape the display, and a polar path creates a radial graph.
-
Set the frequency range in hertz, the number of frequency bands, and maximum height. Then tune thickness, softness, color, display style, and duration averaging. Spectrum offers Digital, Analog Lines, and Analog Dots display styles.
What’s actually slowing this PC down?
Pick the symptom - the matching free tool is one click away.
Special offer. See more information about Outbyte and uninstall instructions. Please review EULA and Privacy policy.Rank #2
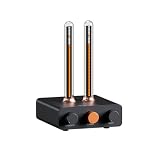 Fosi Audio Music Visualizer, Sound Pickup Spectrum Analyzer, Vintage Tube RGB Ambient Light, Microphone Voice Picking Volume Display Meter for Home Stereo System Desktop, with Sensitivity Adjustment
- Musical Resonance: The lights dynamically pulse to the rhythm of the music, creating an immersive audio-visual experience that enhances both sight and sound. Perfect for desktop, living rooms, parties to elevate visuals
- Multiple Lighting Modes: Equipped with 48 full-color LED chips on each strip as the light source, low-voltage drive for safety and reliability. It features five lighting effects to create a unique ambiance for different scenarios
- Customizable Effects: Adjustable lighting colors, sensitivity, and lights falling speed to match different music rhythms. With built-in microphone pickup, no extra wiring is needed—ensuring pristine audio quality remains uncompromised.
- All-Metal Build: Crafted from CNC-machined aluminum alloy, offering a premium and compact design. The anodized finish delivers a smooth, refined tactile experience, adding a touch of sophistication to your personal space
- Fosi Signature: The crystal clear glass tubes and ring bases are set off by the metallic orange knob perfectly. It is not only a harmonious blend of vintage charm and modern aesthetics, but also a fusion of tube amp aesthetics and Fosi Audio's style
-
For Audio Waveform, choose its path and adjust the visual treatment to suit the composition. Adobe documents both effects and their controls in its audio effects guide.
Adobe cautions that these effects read source footage without time-remapping, effects, stretch, or levels. If those changes need to affect the visualization, precompose the audio layer and use that precomposition as the source.
Explore audio analysis in TouchDesigner
Route audio into an Audio Spectrum CHOP and use its spectrum output to drive a visual element. Derivative describes the node as calculating and displaying the frequency spectrum of input channels. Its documentation also describes a visualization mode and a mode for converting between signal and spectrum representations. See the Audio Spectrum CHOP reference for the node’s documented purpose.
Rank #3

- 🎵 Portable Minimalist Design – Easy to Use Anywhere Sleek, compact, and lightweight design with a smooth matte finish with audio processing chip—perfect for minimalist decor styles. The Novelty Lighting streamlined shape fits seamlessly on desks, car interiors, gaming room or shelves without taking up space. The Audio Visualizer minimalist aesthetic shifts focus to the vibrant light effects rather than bulk, making the music spectrum display a versatile addition to any space
- 🎵 Dynamic Music Visualization with Customizable RGB Effects – This sound activated led light syncs seamlessly with music rhythms and sound input via a built-in high-sensitivity wireless microphone (no extra wiring needed), delivering an immersive audio-visual experience that elevates the atmosphere of desktops, living rooms, game rooms, and parties. Equipped with high-brightness full-color LED chips for stable, low-voltage operation, it offers multiple RGB lighting modes and customizable options (adjust color, dimmable, pickup sensitivity, and dynamic speed) to match different scenes, music styles, and moods.
- 🎵 10 Tube 250 Pixels Dynamic Audio Visualizer – Stunning Spectrum Display Equipped with 10 independent light tubes, this audio visualizer features 250 high-quality individually addressable LED pixels for ultra-fine detail and smooth, vivid light effects. The high-sensitivity built-in microphone syncs perfectly with music, game audio, and voice, delivering stunning RGB light shows that outperform basic 2/6/8 tube models.
- 🎵 Multi-scene essential for Gaming, Car, Home and Music..—transform your gaming battle station into a pro esports space (syncs with in-game sound for immersive play), easily install it in car interiors via included mounting clips/adhesive pads (fits dashboards/air vents), and use it as Ambient bedroom light, party sound-activated light, or boys room decor...Compact size (6.89" × 0.86" × 3.46") and lightweight (net 79g / 0.17 lbs, gross 149g / 0.33 lbs) for easy portability.
- 🎵 Ready-to-Gift & Hassle-Free Operation, Packaged in a stylish Color Box—no extra wrapping needed! 3 intuitive buttons (No app/WiFi required) let you switch modes, adjust colors/brightness in seconds. Perfect Birthday/Christmas/White elephant gift for car owner, gamers, teen boys, and music lovers...
This establishes the audio-analysis capability, not a complete step-by-step project recipe. The exact node configuration and export workflow depend on the build you create; choose this route when node-based, interactive control is part of the goal.
Do these 3 things before closing this tab:
1Repair Windows errors before they cause bigger problems2Scan for outdated or missing drivers - takes under a minute3Clear out junk files and repair common Windows errorsPreview the response and refine it
-
Check quiet and loud passages, as well as transitions. A setting that looks balanced in one section may overwhelm another.
-
If bars or a waveform look too busy, reduce their height or visual prominence. If movement is hard to see, adjust the mapping and preview again.
Rank #4
 RGB Audio Visualizer, Spectrum Analyzer for Sunlight Alarm Clock, 384 RGB Colorful, 1624 Segment Rhythm Light Level, Voice Sensor Clock Display, 20 Dynamic 7 Color Effect, Gifts for Music Lovers
- LED LIGHT: The audio spectrum analyzer consists of 384 RGB LEDs with 1624 segment rhythm light level voice sensor
- MULTIPLE FUNCTIONS: The audio visualizer features 20 dynamic effects, 7 color effects, and can form 140 different display effects
- 2 CONTROL MODE: This music visualizer supports voice control and line control mode. Voice control will be pulsating with the sound; line control mode will be pulsating with the music of the audio input
- USB POWER SUPPLY: The music spectrum with RGB lights is powered by USB 5V and can be applied through a phone charger or computer USB (not support charging)
- PREMIUM QUALITY: The spectrum analyzer home audio is made of high-quality ABS material, and the glossy appearance is easy to clean and maintain
-
In After Effects, duration averaging is available to reduce randomness in displayed frequencies; preview the result to decide whether it suits the track.
-
Check that the source audio behaves as intended. Effects, time-remapping, stretch, and levels applied outside the source read by Audio Spectrum or Audio Waveform are not reflected; precompose when they must influence the visualization.
Quick wins for a faster PC:
Scan for outdated or missing drivers - takes under a minuteDriver Scan →Repair Windows errors before they cause bigger problemsFix Now →Fix the driver behind crashes, sound loss and screen glitchesFind Drivers →Special offer. See more information about Outbyte and uninstall instructions. Please review EULA and Privacy policy.
Set up the final render
For a rendered video, confirm the composition’s duration, frame dimensions and orientation, intended destination, and whether the receiving workflow needs transparency or a high-quality intermediate. Adobe’s Render Queue tutorial demonstrates setting the work-area or composition duration, choosing QuickTime and a codec, selecting an output destination, and rendering.
Best Value

- PROJECTION DISTANCE- Projection up to 33 feet in darker environment,A brighter environment can project up to 16 feet.
- GOOD PROJECTION SYSTEM - HD Wear-resistant Glass lens! Aluminium Machine! LED Gobo Light have efficient and stable components, durable light source, projecting GOBO stably, long projection time.(3 Years Warranty)
- APPLICATIONS - Ideal for Weddings, Store, Christmas, Halloween, Hotel, Disco, Clubs, KTV, Pub, Bar, Banquet, Family Parties and others indoor business advertising campaign use.
- NOTE: Easy installation - A wall, floors, and ceiling You must use it indoors or in a place sheltered from water.
- Free Gobo len:We give a free gobo lens, please send your gobo to us, please refer to the picture for contact information.
Adobe’s broadcast-quality example includes Apple ProRes 422 and DNxHR/DNxHD options; it describes ProRes 4444 as an example for graphics with an alpha channel. Those are tutorial examples, not mandatory or universal social-media presets. Match the format and codec to the platform or production pipeline that will receive the file, and check the current options in your software.
Keep music and visual rights in view
Before distributing the finished visual, confirm you have the necessary rights for the music and any visual assets you use. Requirements depend on the work and intended distribution; credit, noncommercial use, or a short excerpt does not automatically make a use permissible. Consult authoritative guidance relevant to your location and use.
What one study does—and does not—show
A 2021 paper by Max Graf, Harold Chijioke Opara, and Mathieu Barthet evaluated a particular system for real-time music visualization. Its first stage involved 34 participants, and the authors reported that the system’s generated visualizations complemented the music significantly better than a baseline visualization. Nine participants took part in the second stage, where the reported Creativity Support Index was 68.1 and the System Usability Scale index was 58.6. These are results for that system and study, not evidence that music visualizers generally improve audience response or that one software tool is superior. Read the paper.
Quick Recap
Product prices and availability are accurate as of the date/time indicated and are subject to change. Any price and availability information displayed on Amazon at the time of purchase will apply.

