
Free tools Windows power users keep installed
One-click scans. No signup required.
iTechGuides is reader-supported. When you buy through links on our site, we may earn an affiliate commission. As an Amazon Associate I earn from qualifying purchases. Learn more
These four tools do not trace the same thing in the same way. LangChain and LangGraph offer framework-aware integrations with LangSmith or MLflow; Dify documents forwarding workflow and chatflow monitoring data to LangSmith; OpenClaw exports runtime diagnostics through an OpenTelemetry plugin. That difference in instrumentation boundary—not simply whether tracing exists—is the key to choosing and interpreting a setup.
What a trace means—and what it does not guarantee
In OpenTelemetry’s model, a trace is a set of related spans, often arranged as a parent-and-child tree. Each span represents an operation and can carry a name, context, parent, timestamps, attributes, events, and status. A SpanContext follows W3C TraceContext and includes trace and span identifiers and flags.


This vocabulary helps describe telemetry, but it does not prove that LangChain, LangGraph, Dify, and OpenClaw emit matching fields, identical parent-child relationships, or equivalent amounts of detail. A workflow run, a framework execution, and a runtime diagnostic span may each be useful traces while representing different units of work.
How the instrumentation boundaries differ
| Platform | Documented boundary | Route and destination | Documented detail |
|---|---|---|---|
| LangChain | Framework and model-call instrumentation | LangSmith tracing or MLflow autologging | Official integration docs describe automatic tracing of model calls with LangSmith and tracing LangChain applications with MLflow. |
| LangGraph | Framework/application instrumentation | MLflow autologging is documented for LangGraph applications | The MLflow guide covers LangGraph; it does not establish that its traces match LangSmith’s schema. |
| Dify | Workflow and chatflow monitoring | Dify’s documented integration forwards monitoring data to a configured LangSmith project | The Japanese-language guide lists run-level and node-execution information, including inputs, outputs, token use, metadata, and errors. |
| OpenClaw | In-process diagnostics events | The diagnostics-otel plugin exports over OTLP/HTTP using protobuf to a compatible collector or backend |
It exports metrics, traces, and logs; trace content capture is separately controlled. |
The table reflects documented integration routes, not a one-to-one comparison of generated spans. For example, Dify’s node-execution details do not establish that its exported hierarchy is the same as a LangChain framework trace.
#1 Best Overall
How do I enable LangSmith tracing for LangChain?
The LangChain OpenAI integration documentation describes enabling automatic LangSmith tracing of model calls with a LangSmith API key and LANGSMITH_TRACING=true. Model-provider credentials are a separate part of the integration setup; tracing is optional alongside them.
LANGSMITH_API_KEY=your-langsmith-api-key
LANGSMITH_TRACING=true
Set the key and tracing variable in the environment used by the application before running it. The documentation’s setup is specifically about the LangChain OpenAI integration; it should not be read as a claim that every LangChain provider or deployment uses an identical configuration.
How do I trace LangGraph with MLflow?
LangChain’s MLflow integration guide uses mlflow.langchain.autolog() to enable tracing for LangChain applications and also documents its use with LangGraph applications.
Recommended Free Tools
Rank #2

- 【Space-Saving Compact Design】Designed with a compact 10-inch width, this network rack saves valuable space while providing enough room to organize and mount essential equipment. Measuring 10.4 x 9.4 x 16.6 inches, it is ideal for space-efficient installations while maintaining reliable functionality
- 【Heavy-Duty Load Capacity】The 8U Network rack open frame is made of durable cold-rolled steel, providing strong support and reliable durability. The reinforced Rack shelf supports enhance overall stability and help securely hold mounted equipment
- 【Wide Equipment Compatibility】Designed to support 10-inch rack-mountable equipment, this rack is compatible with patch panels, network switches, cable organizers, and power strips, offering flexible installation solutions for various networking and electronics applications
- 【Enhanced Airflow & Clear Visibility】The open-frame structure promotes excellent airflow for improved cooling performance, while the transparent panels provide clear visibility of device indicators and help protect equipment from dust. This design ensures efficient heat management while allowing easy monitoring of your setup
- 【Complete Accessory Kit Included】The package includes 1 blank panel, 1 Brush Panel, 1 rack shelf, and all necessary mounting hardware, providing everything you need for a convenient, customizable, and efficient installation
import mlflow

mlflow.langchain.autolog()
The guide specifies MLflow 2.14.0 or later for tracing. This route may be suitable when MLflow is already part of the application’s workflow, but the documentation does not say that MLflow and LangSmith produce equivalent trace schemas or payloads.
How do I send Dify workflow traces to LangSmith?
Dify’s official Japanese-language integration guide describes configuring a LangSmith project and API key, then entering the key and matching project name in Dify’s monitoring settings. The documented integration covers workflow and chatflow monitoring data. Because the guide is localized, check the labels in the corresponding Dify interface rather than assuming an English label or menu path.
The guide describes data such as start and end times, inputs, outputs, token use, metadata, errors, and node-execution information. Its listed identifiers and fields include workflow ID, conversation ID, tenant ID, elapsed time, status, version, token totals, file list, and trigger source. These are workflow-monitoring details; they do not by themselves establish a span layout equivalent to LangChain’s framework-level instrumentation.
How does OpenClaw export OpenTelemetry traces?
OpenClaw documents an official diagnostics-otel plugin that subscribes to structured in-process diagnostics events and exports metrics, traces, and logs over OTLP/HTTP using protobuf. A collector or backend must accept OTLP/HTTP. The plugin attaches only when both diagnostics and the plugin are enabled.
The documentation names Grafana, Datadog, Honeycomb, New Relic, and Tempo as examples of compatible destinations. Those are examples of the backend category, not a claim that OpenClaw has a dedicated integration with each one.
OpenClaw also documents accepting an upstream W3C traceparent on authenticated Gateway WebSocket request frames. It preserves the upstream trace ID and sampling flags in request-scoped context. The exported span identities should not be confused with diagnostic IDs used for local correlation: the docs describe those as distinct identifiers.
Rank #4
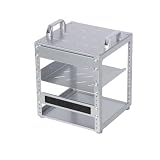
- 【Space-Saving Compact Design】Designed with a compact 10-inch width, this network rack saves valuable space while providing enough room to organize and mount essential equipment. Measuring 10.45 x 9.45 x 13.15 inches, it is ideal for space-efficient installations while maintaining reliable functionality
- 【Heavy-Duty Load Capacity】The 6U Network rack open frame is made of durable cold-rolled steel, providing strong support and reliable durability. The reinforced Rack shelf supports enhance overall stability and help securely hold mounted equipment
- 【Wide Equipment Compatibility】Designed to support 10-inch rack-mountable equipment, this rack is compatible with patch panels, network switches, cable organizers, and power strips, offering flexible installation solutions for various networking and electronics applications
- 【Enhanced Airflow & Clear Visibility】The open-frame structure promotes excellent airflow for improved cooling performance, while the transparent panels provide clear visibility of device indicators and help protect equipment from dust. This design ensures efficient heat management while allowing easy monitoring of your setup
- 【Complete Accessory Kit Included】The package includes 1 blank panel, 1 Brush Panel, 1 rack shelf, and all necessary mounting hardware, providing everything you need for a convenient, customizable, and efficient installation
What data can OpenClaw include in traces?
Raw model and tool content is not exported by default under OpenClaw’s documented behavior. Operators can enable diagnostics.otel.captureContent to include bounded, redacted messages and tool content, subject to exclusions that include system prompts and provider-internal thinking payloads.
Content capture changes the sensitivity of the exported telemetry. OpenClaw’s documentation advises enabling it only when the collector and its retention policies have been approved for that data. The reviewed documentation does not provide equivalent content-capture detail for LangChain, LangGraph, or Dify, so their privacy behavior should not be inferred from OpenClaw’s controls.
Deployment and data-control differences
LangSmith Agent Server’s data-plane documentation describes different tracing behavior by deployment mode: tracing to LangSmith SaaS is required for Cloud, while Hybrid and Self-Hosted can disable tracing or route it to documented LangSmith destinations. Self-hosted LangSmith is listed as an option in the Self-Hosted column. This applies to the Agent Server deployment modes described there; it is not a deployment matrix for Dify, OpenClaw, or every LangChain application.
Best Value

- [ Maximum AI Compute Power ] Dominate complex workloads with the ASUS ESC8000A-E13. This 4U rack server is a powerhouse engineered for mass-scale AI, machine learning, and deep training. Featuring support for dual AMD EPYC 9005/9004 processors and up to eight dual-slot GPUs, it delivers the raw computational muscle required to train LLMs and run complex simulations effortlessly. Accelerate your data science pipeline and transform raw data into actionable intelligence faster than ever.
- [ Advanced Thermal Efficiency ] High performance demands elite cooling. The ESC8000A-E13 features a cutting-edge aerodynamic design with independent CPU and GPU airflow tunnels. Equipped with redundant hot-swap fans and optimized for liquid cooling integrations, this 4U server ensures maximum uptime under heavy, sustained workloads. Keep your data center running cool, quiet, and highly efficient while preventing thermal throttling during mission-critical enterprise operations.
- [ Scale with Flexible Storage ] Future-proof your infrastructure with unmatched storage and expansion flexibility. This offers comprehensive front-panel drive bays supporting Gen5 NVMe, SAS, or SATA drives alongside multiple PCIe 5.0 slots. Designed as a high-density 4U server capable of housing eight dual-slot GPUs: NVD H200, RTX PRO 6000 Blackwell, RTX PRO 4500 Blackwell or AMD Instinct MI350P PCIe Card, each supporting up to 600 watts.
- [ Enterprise-Grade Reliability ] Minimize downtime and secure your ecosystem with server-grade redundancy. The ESC8000A-E13 is built for 24/7 continuous operation, boasting 2+2 redundant (3200W total) 80 PLUS Titanium power supplies and integrated ASUS ASMB11-iKVM for comprehensive out-of-band management. Ideal for cloud service providers, rendering farms, and large enterprise infrastructure, it combines robust physical hardware with smart remote monitoring to safeguard your digital assets.
- [Reliability Guaranteed] Shop with total peace of mind knowing that every new computer component we sell is backed by our EPC 3-year warranty. Whether you are investing in high-speed DDR5 RAM or a powerhouse GPU, we protect your build against defects and performance failures. We stand firmly behind the quality of our hardware, ensuring that your setup remains fast, stable, and secure for years to come.
For OpenClaw, the documented export protocol and plugin boundary make the receiving OTLP/HTTP collector part of the deployment decision. The source material establishes neither a shared retention policy across these systems nor a universal default for where each platform stores telemetry.
Which tracing route fits the question you need to answer?
- Need framework-aware model-call tracing in a LangChain app? The documented LangSmith route uses an API key and
LANGSMITH_TRACING=true. - Already using MLflow for a LangChain or LangGraph application? The documented switch is
mlflow.langchain.autolog(), with MLflow 2.14.0 or later required for tracing. - Need Dify workflow or chatflow execution visibility in LangSmith? Configure the project name and API key in Dify’s monitoring settings as described in its integration guide.
- Need runtime diagnostics sent to an OTLP/HTTP receiver? OpenClaw’s
diagnostics-otelplugin is the documented exporter; decide separately whether content capture is appropriate.
Choose based on the operation you need to inspect and the data you are prepared to export. The available documentation supports comparing these boundaries and controls, but not declaring one platform categorically superior or treating their traces as interchangeable.
Quick Recap
Product prices and availability are accurate as of the date/time indicated and are subject to change. Any price and availability information displayed on Amazon at the time of purchase will apply.

