
What’s actually slowing this PC down?
Pick the symptom - the matching free tool is one click away.
iTechGuides is reader-supported. When you buy through links on our site, we may earn an affiliate commission. As an Amazon Associate I earn from qualifying purchases. Learn more
If you want to see what is using RAM in Windows, start with Task Manager. For a deeper look at how physical memory is allocated, use Microsoft RAMMap; for process and loaded-file context, use Process Explorer; and to track changes over time, use Performance Monitor (PerfMon). If you specifically want a tray utility that also cleans memory, Mem Reduct is the closest alternative covered here—but cleaning memory is not the same as diagnosing a problem.
What MemoryCleaner does—and what it does not establish
Kilhonet describes Memory Cleaner version 2.0.0 as a no-install utility that cleans several areas of memory and can clean automatically according to settings. Its update history notes improvements to automatic memory-usage monitoring stability and fixes related to long-running timers and cleaning behavior on June 8, 2026. Its FAQ says automatic cleaning can be triggered by memory usage or time intervals. These features combine basic monitoring with cleanup; the cited information does not describe detailed allocation analysis or a history of memory use. See Memory Cleaner’s update history and FAQ.
Which alternative should you choose?
| What you need | Tool | Best fit |
|---|---|---|
| A quick view of current resource use | Task Manager | Built into Windows; shows resource consumption, including memory, and lets you manage running applications. |
| Details about physical-memory allocation | RAMMap | Shows categories such as process working sets, prioritized standby lists, physical pages, and file data held in RAM. Analysis tool, not a tray cleaner. |
| Process ownership and loaded-object context | Process Explorer | Shows process ownership and files, registry keys, DLLs, and other objects processes have open or loaded. |
| A logged view of memory behavior over time | Performance Monitor (PerfMon) | Graphs and records Windows counters, which can help reveal trends when investigating a suspected leak. |
| Tray monitoring with optional cleanup | Mem Reduct | Its publisher describes real-time tray monitoring, cache and standby-list cleanup, automatic thresholds, and Windows 7, 10, and 11 support. |
Use Task Manager for a quick first check
Task Manager is the simplest place to check current memory use without installing another utility. Microsoft describes it as a system monitor for resource consumption, including memory, as well as a way to manage running applications. It is useful for a snapshot and for spotting processes that appear to be using substantial resources; it does not provide RAMMap’s physical-allocation views or PerfMon’s logged history. Microsoft’s Task Manager overview.
Use RAMMap to understand where physical memory is allocated
RAMMap is the better choice when a headline memory figure does not answer your question. It breaks physical-memory use into categories that include process working sets, prioritized standby lists, physical pages, and file data cached in RAM. That additional context can help explain why memory appears occupied without identifying a single application as the cause.
#1 Best Overall

- 11.3” Wide LCD Screen – Features a crisp 1920×480 resolution display, perfect for showcasing system stats, hardware performance, or personalized visuals inside your gaming PC.
- Real-Time Hardware Monitoring – Easily track CPU/GPU temps, fan speed, memory usage, and more, giving you complete control of your system health at a glance.
- TRCC Software with DIY Options – Includes Thermalright TRCC app with multiple preset themes and DIY customization, so you can design your own unique interface
- Plug & Play USB-C Connection – Simple Type-C interface ensures quick setup and compatibility with most Windows systems, no complicated drivers required.
- Compact & Stylish Build – At only L272 mm x W70 mm x H14 mm, this slim display fits seamlessly inside or outside your PC case, adding both function and aesthetic appeal for modders and enthusiasts.
Microsoft lists RAMMap for Windows Vista and later. The current version documented on its page is 1.63, published March 26, 2026. RAMMap’s author, Mark Russinovich, describes it as a way to understand Windows memory management, analyze application memory usage, and answer questions about RAM allocation. Download and read about RAMMap v1.63.
Use Process Explorer for process and object context
Process Explorer helps when you need to identify a process and learn more about what it has open or loaded. Microsoft says it can show files, registry keys, and other objects a process has open, its loaded DLLs, and process ownership. This context can help investigate a particular process, but the cited overview does not describe RAMMap-style analysis of physical pages. Pair the tools when you need both process details and a broader view of physical-memory allocation. Microsoft’s Process Explorer overview.
Rank #2

- COMPACT, STYLISH, POWERFUL: Ultra-small and light, the EXCERIA PLUS G2 Portable SSD fits reliable high-performance in a sleek and stylish aluminum housing. Data transfer with speeds of up to 1,050MB/s read and 1,000MB/s write make it a handy storage device ideal for gamers, creators and professionals on the go.
- WIDE DEVICE COMPATIBILITY: Plug and play with Windows OS, macOS, iPadOS, iOS, AndroidTM OS, PS4, PS4 Pro, PS5 and Xbox Series X/S. Quickly transfer 4K videos and high-res files via 3.2 Gen2 – includes USB Type-C to C and Type-C to A cables for use with modern and legacy devices.
- WORRY-FREE PORTABILITY: Featuring a durable, shockproof design compliant with the MIL-STD drop test. The aluminium casing improves heat dissipation for stable performance – even during heavy workloads. For peace of mind, you can password protect and safeguard your data.
- BiCS FLASH – MADE IN JAPAN: Built with KIOXIA's cutting-edge BiCS FLASH 3D flash memory, each drive offers reliable, high-density storage for fast data access.
- DATA SECURITY & MONITORING: Password protection and 256-bit AES hardware encryption ensure data security. Also use KIOXIA’s SSD Utility management software to maximize your drive’s performance, monitor its health and the remaining lifespan.
Use PerfMon to investigate a suspected leak over time
A single reading cannot show whether memory use is steadily increasing. Performance Monitor can graph and log counters so you can observe behavior over time. Microsoft’s leak guidance names Pool Nonpaged Bytes, Pool Paged Bytes, and Paging File % Usage as counters to watch. The point is to look for sustained trends, rather than treating one high reading as proof of a leak. Microsoft’s PerfMon memory-leak guidance.
The Tool Desk
Outbyte Driver Updater FREEScan for outdated or missing drivers - takes under a minuteDriver Scan →Outbyte PC Repair FREERepair Windows errors before they cause bigger problemsFix Now →PerfMon does not identify the source of a leak or confirm on its own whether the issue is in user mode or kernel mode. Its counters are evidence for further investigation, not a diagnosis by themselves. Microsoft’s broader guidance explains recording counter data with Data Collector Sets; some detailed thresholds are written for Windows Server and should not be treated as universal consumer-PC limits. Microsoft’s Performance Monitor guidance.
Rank #3

- INSTALLED ON WINDOWS, REPLACES OUTDOOR CAMERAS: This camera installs easily on any interior window, allowing you to monitor the outside without the need for complicated outdoor installations.
- FULL-COLOR NIGHT VISION: Enjoy clear, full-color night vision through glass, even in low-light conditions—star and moonlight are enough to capture vivid, detailed images.
- 2K RESOLUTION & WIDE VIEW: Capture sharp, detailed footage with 2K resolution and a 106 degree wide-angle lens for broader coverage. The anti-glare and anti-reflection design ensures a clear view, even at night.
- AI-POWERED MOTION & PERSON DETECTION: Detects motion and people with AI, sending alerts to your smartphone. Enjoy free 24/7 continuous recording on the included SD card, while cloud storage for alert footage is required with a SUBSCRIPTION PLAN.
- DUAL-BAND WI-FI & APP CONTROL: Connect to 2.4GHz or 5GHz Wi-Fi for a stable connection and manage the camera through the EOJO App on iPhone or Android.
Choose Mem Reduct only if cleanup is part of the goal
Mem Reduct is the closest match here if you want monitoring and an optional cleanup action in one utility. Its publisher describes real-time tray monitoring, cache and standby-list cleanup, automatic thresholds, and support for Windows 7, 10, and 11. Its recovery percentages and performance benefits are publisher claims, not independent test results. No independent head-to-head performance test against Memory Cleaner is established here. See the Mem Reduct publisher’s site.
Keep the distinction clear: monitoring tells you what memory use is doing; cleanup changes memory state. A before-and-after free-memory number does not by itself show that an application had a leak or that the computer will perform better. For a suspected leak, logged trends and targeted investigation are more informative than a one-time cleanup.
Quick Recap
Best Value
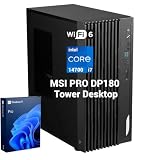
- 【HIGH-PERFORMANCE BUSINESS PROCESSOR】 Equipped with Intel Core i7-14700 processor to handle heavy multitasking, data analysis and commercial software for reliable business operation
- 【8K & MULTI-DISPLAY PRODUCTIVITY】 Supports up to 8K resolution output and multi-screen setup to boost work efficiency for designers, analysts and office staff
- 【ENTERPRISE-GRADE SECURITY】 Built-in Hardware TPM 2.0, paired with Kensington Lock and Padlock slots to protect confidential business data and physical device assets
- 【DUAL MSI MANAGEMENT SOFTWARE】 Integrated MSI Cloud Center for cross-device file backup & synchronization and MSI Center for hardware monitoring, system cleanup, recovery and troubleshooting
- 【VERSATILE FULL-SCALE I/O PORTS】 Complete front and rear I/O layout including USB Type-C, dual 2.5G+1G RJ45 LAN, HDMI 2.1, DP 1.4, VGA, COM, PS/2 and SD card reader to connect all office peripherals seamlessly
Rank #4

- [Single-Cable Connection & Universal Compatibility] System Compatibility & Custom Theme Support: Only compatible with Windows desktop & laptop systems; NOT work with macOS, MacBook, iMac and all Apple devices; you can use built-in factory preset templates directly, or import self-made custom templates via the official manufacturer software.
- [Pro-Level Brightness & Customization Software] Utilize proprietary software to precisely adjust screen brightness from 200 to 1000 nits for optimal visibility in any environment. The platform also supports extensive customization, including built-in dynamic themes and the ability to import personal designs for a truly unique display.
- [Comprehensive Real-Time System Monitoring] Serves as a dedicated system dashboard, providing live monitoring and display of critical hardware metrics including CPU/GPU temperature and usage, RAM and storage statistics, fan speeds, and network performance for complete system oversight.
- [Complete Installation Kit for Flexible Setup] Includes a comprehensive installation kit with a PC case bracket, screw set, and strong adhesive strip for versatile mounting options. The package is completed with a detailed English manual for a straightforward setup process.
A practical way to investigate high RAM use
- Check the snapshot: Open Task Manager and look at memory use and the processes consuming resources.
- Inspect allocation: If the overall figure remains unclear, use RAMMap to examine physical-memory categories, including standby lists and cached file data.
- Investigate a process: Use Process Explorer when you need ownership or loaded-object details for a specific process.
- Track a pattern: If you suspect memory use is growing over time, log relevant PerfMon counters and observe whether the change is sustained.
- Separate diagnosis from cleanup: Use a cleaner only if you want its cleanup function; do not treat reclaimed memory alone as proof of a fix.
How to make sense of the readings
- High RAM use is not a diagnosis. It does not by itself identify a responsible process or prove a leak.
- Cached or standby memory needs context. RAMMap can show allocation categories that a simple total does not explain.
- A process view and a physical-allocation view answer different questions. Process Explorer supplies process and loaded-object context; RAMMap examines physical-memory allocation.
- Trends matter for leak investigation. PerfMon can record changes, but it cannot identify the source or independently establish the leak’s mode.
Product prices and availability are accurate as of the date/time indicated and are subject to change. Any price and availability information displayed on Amazon at the time of purchase will apply.

